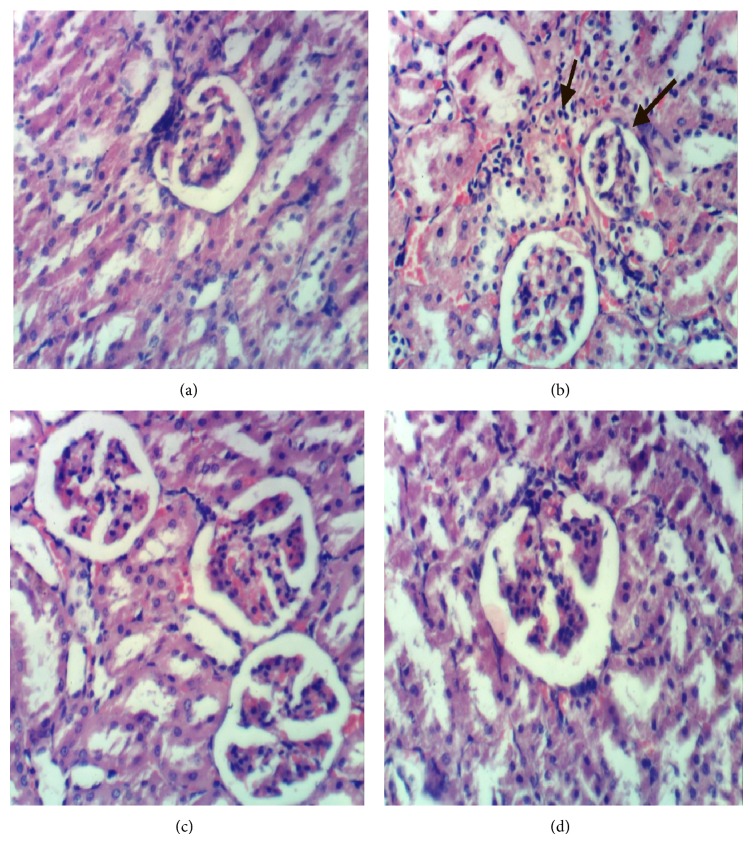
Figure 3.
(a) Kidney of rat from the negative control group G1 showing normal histological structure of renal parenchyma and glomeruli, (b) kidney of hypercholesterolemic rat from G2 showing atrophy of glomerular tuft, (c) kidney of rat from G3 showing no histopathological changes, and (d) kidney of rat from group 4 showing no histopathological changes (H&E ×400).

