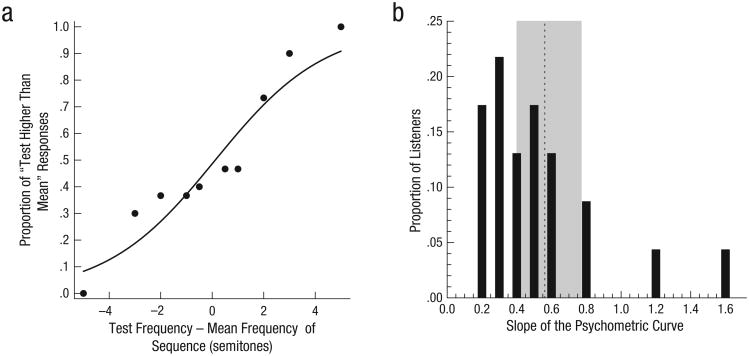
Fig. 2.
Results of Experiment 1. The psychometric curve in (a) shows the proportion of responses from a representative listener in which the frequency of the test tone was identified as higher than the mean frequency of the preceding tone sequence as a function of the difference (in semi-tones) between the test tone and the sequence mean. The histogram (b) shows the distribution of psychometric curve slopes across all 23 listeners. Chance performance corresponds to a slope of zero. The group mean is indicated by the vertical dashed line, and the gray shading indicates the 99% confidence interval (obtained by bootstrapping).

