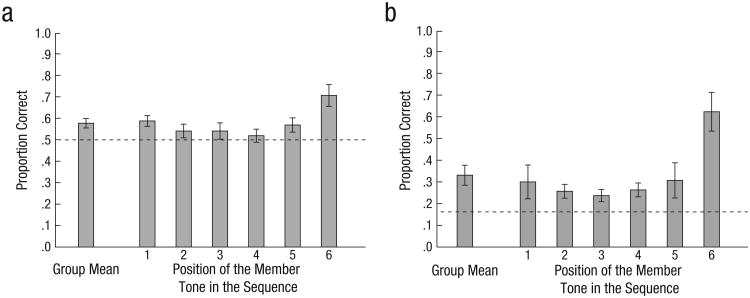
Fig. 4.
Results of (a) Experiment 3 and (b) Experiment 4: mean proportion of correct responses when identifying which of two test tones was a member of the preceding sequence and reporting the temporal position of a given member tone, respectively, as a function of the position of the member tone in the preceding sequence. The group mean is also shown. The dashed lines indicate chance-level performance. Error bars represent ±1 SEM.

