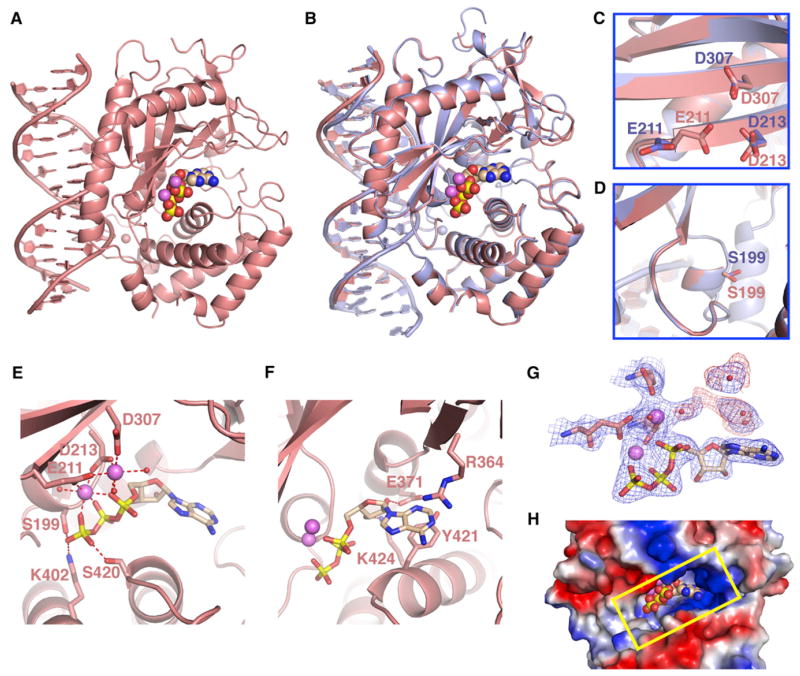
Figure 2. Structure of the Ternary Complex of cGAS, dsDNA, and ATP.
(A) 2.4 Å crystal structure of the ternary complex of cGAS bound to dsDNA and ATP. The protein and dsDNA are colored in salmon in the ternary complex, with bound ATP in a space-filling representation.
(B) Superposed structures of the binary complex of cGAS and DNA (blue) and the ternary complex with added ATP (salmon).
(C and D) Absence of changes in the backbone within the β sheet (C) and catalytic pocket (D) segments were observed for the transition from the binary cGAS and dsDNA complex (blue) to the ternary complex with added ATP (salmon).
(E and F) Two alternate views of intermolecular contacts between ATP and catalytic pocket residues in the ternary complex. Two cations are shown as magenta spheres, with hydrogen bonds shown by dashed red lines.
(G) 2Fo-Fc electron density map contoured at 1.2σ (blue) and Fo-Fc map contoured at 3.0σ (red) of bound ATP and a pair of cations and coordinating residues in the catalytic pocket of the ternary complex. This map contains some weak unaccounted for electron density (red).
(H) View of bound ATP in a space-filling representation within the catalytic pocket, with the protein in an electrostatic representation.
See also Table S2.

