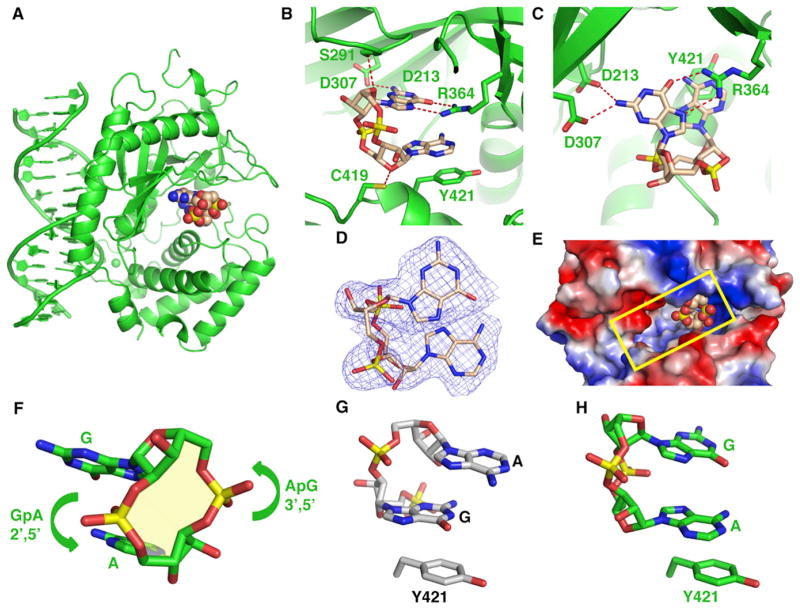
Figure 4. Structure of the Ternary Complex of cGAS and DNA with Bound Product c[G(2′,5′)pA(3′,5′)p].
(A) 2.3 Å crystal structure of the ternary complex of cGAS bound to dsDNA and product c[G(2′,5′)pA(3′,5′)p]. The protein and DNA are colored in green in the ternary complex, with bound product c[G(2′,5′)pA(3′,5′)p] in a space-filling representation.
(B and C) Two alternate views of intermolecular contacts between product c[G(2′,5′)pA(3′,5′)p] and catalytic pocket residues in the ternary complex.
(D) 2Fo-Fc electron density map contoured at 1.2σ (blue) of bound c[G(2′,5′)pA(3′,5′)p] in the catalytic pocket of the ternary complex.
(E) View of bound c[G(2′,5′)pA(3′,5′)p] in a space-filling representation positioned toward one end of the catalytic pocket, with the protein in an electrostatic representation.
(F) A view of c[G(2′,5′)pA(3′,5′)p] highlighting the 2′,5′ linkage at the GpA step and the 3′,5′ linkage at the ApG step.
(G) Stacking of the G residue of 5′-pG(2′,5′)pA on Tyr 421 in its ternary complex with cGAS and dsDNA.
(H) Stacking of the A residue of c[G(2′,5′)pA(3′,5′)p] on Tyr 421 in its ternary complex with cGAS and dsDNA.

