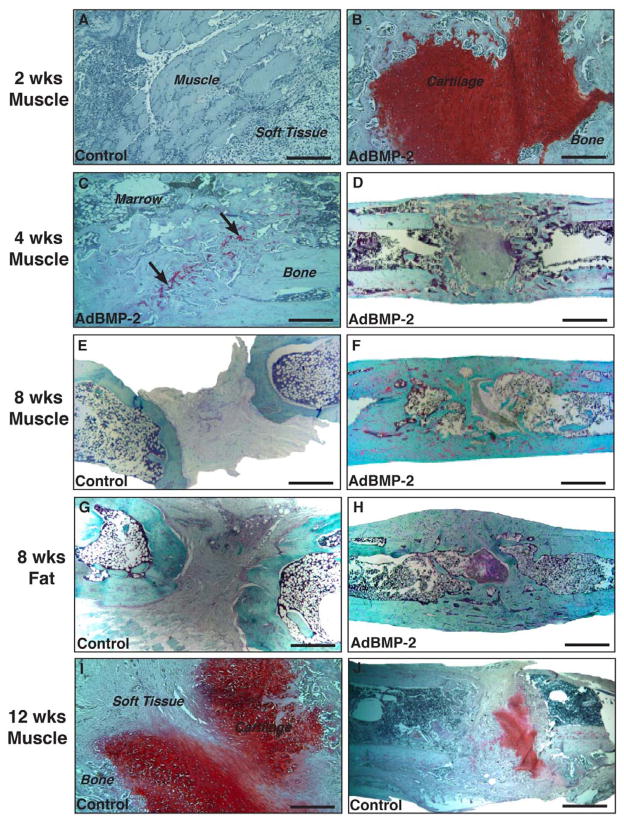
Figure 8.
Histological examination of rat femora after implantation of gene-activated muscle and fat grafts. All sections were stained with safranin O-fast green after euthanasia at the indicated time points after surgery. Low power (D,E,F,G,H,J) and high power (A,B,C,I,) images are shown (bar = 2mm low power, bar = 2003m high power). Arrows in panel C point to areas of residual proteoglycan.

