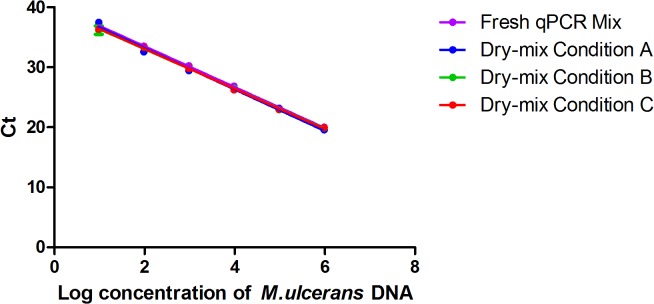
Fig 2. Comparison between 3 dry-reagent conditions and the standard reference method, based on an external standard curve.

Serial 10-fold dilution from 1x10⁶ U/ml to 1x100U/ml of M. ulcerans DNA. The serial curve was generated by a linear regression of the threshold cycle (Ct) against the logarithm of M. ulcerans DNA concentration. Each 10-fold dilution was performed in triplicate. One standard deviation to either side of the mean is shown. Standard QPCR Mix refers to the reference method with fresh mix (y = −3.4107x + 40.357); dry-mix condition A refers to the dry mix containing 5% cryo T and 1% cryo P (y = −3.2333x + 39.087); dry-mix condition B refers to the dry mix containing 10% cryo T and 1% cryo P (y = −3.3727x + 39.942); dry-mix condition C refers to the dry mix containing 7.5% cryo T and 0.5% cryo P (y = −3.357x + 39.851). For each assay, the coefficient of correlation was greater than 0.99.
