
Fig 4. CT values for the 19 weakly positive samples, for 2 conditions.
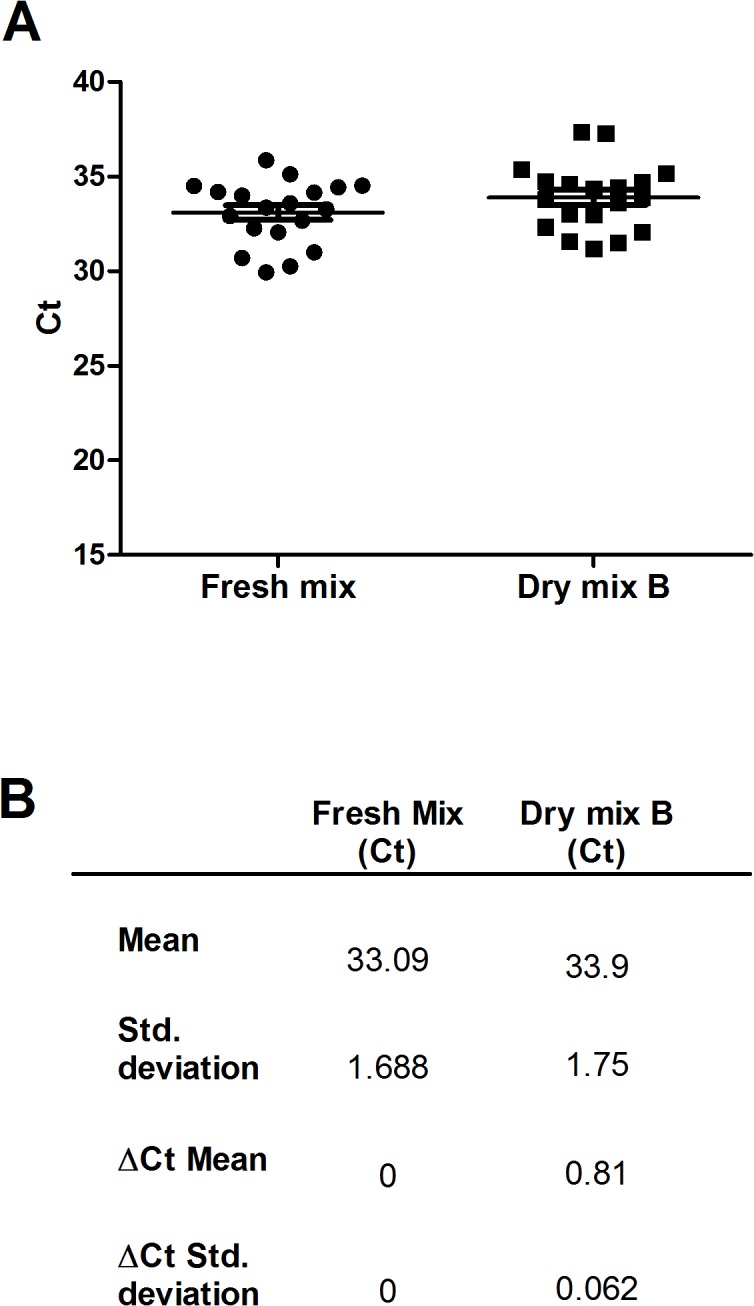
(A) Ct results for each sample obtained by the fresh mix and the dry mix B, Horizontal bars indicate mean values ± SD. (B) Mean values ± SD and average ΔCt ± SD between fresh mix and dry mix B.