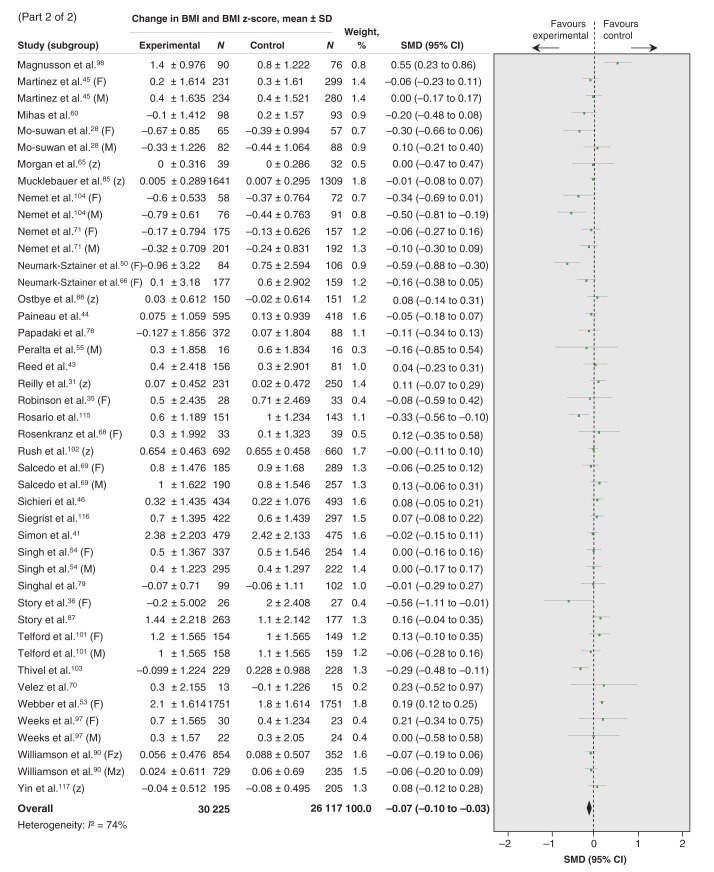
Figure 3B:
Effect of prevention interventions on change in body mass index (BMI) and BMI z-score. Values less than 0 indicate a change in BMI in favour of the intervention. 1 = intervention arm 1; 2 = intervention arm 2; CI = confidence interval; F = female; M = male; SD = standard deviation; SMD = standardized mean difference; z = BMI z-score.

