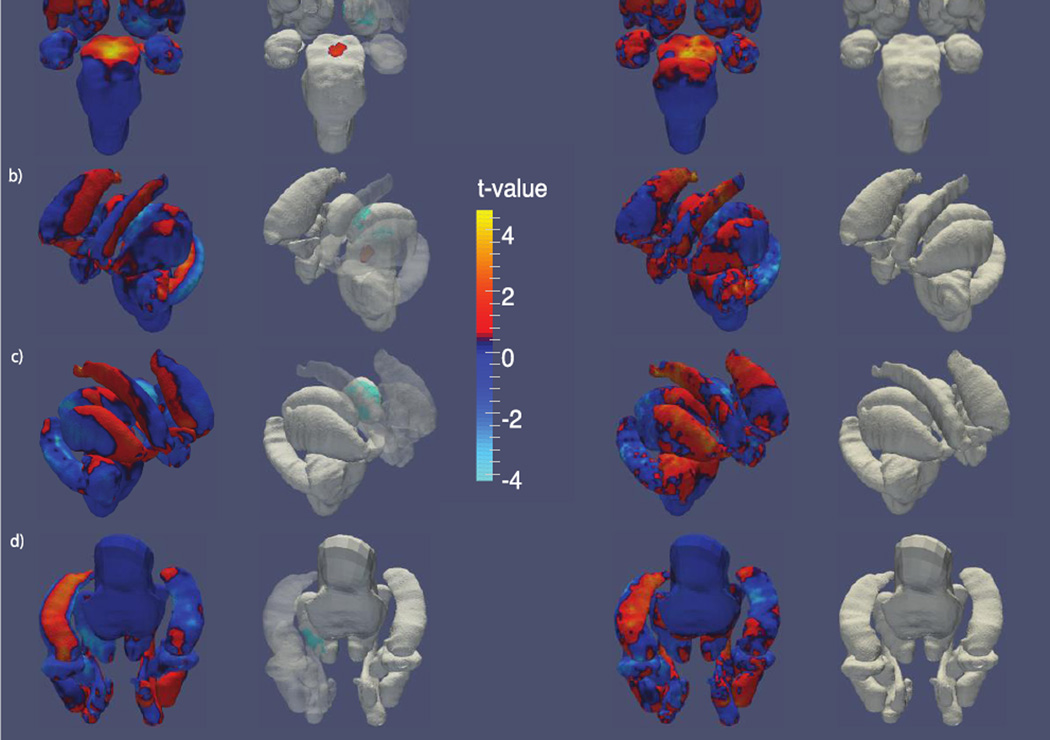
Figure 2.
Shape variation by HIV status. T-value maps of radial distance (left) and the Jacobian determinant (right) from a) anterior, b) left, c) right and d) inferior perspectives. The second and third columns each show t-value maps that have been thresholded to show regions significant after FDR correction.

