Figure.
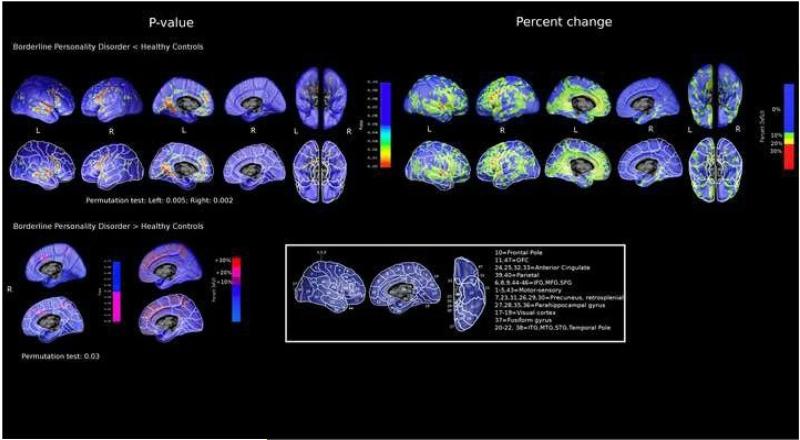
Cortical morphology in 26 Borderline Personality Disorder (BPD) patients compared to 26 healthy controls. Pattern of percent gray matter local difference (right panel) and statistical significance (left panel) in BPD<HC and BPD>HC , with (lower row) and without (upper row) Brodmann areas' (BAs) boundaries highlighted

