
FIGURE 4.
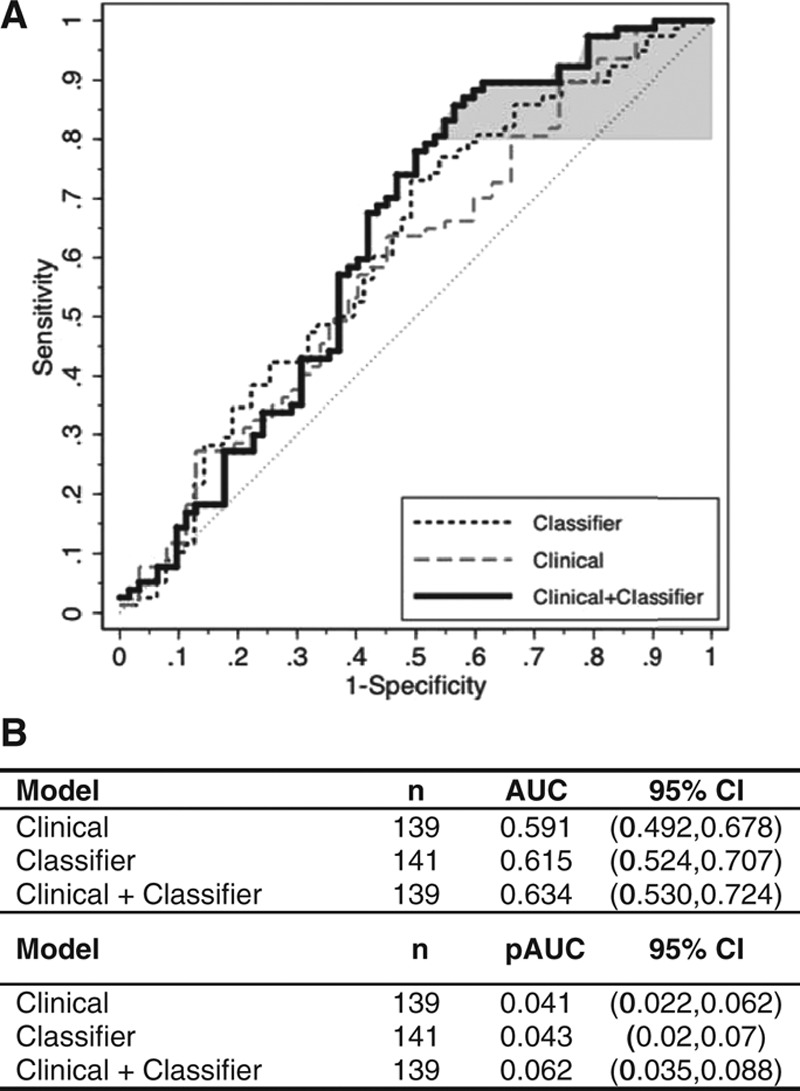
Incremental diagnostic value of the protein expression classifier to a clinical lung nodule prediction model. Shown are the respective ROC curves for the clinical model48 alone (grey dashed line), the protein expression classifier alone (black dashed line), and the model combining the protein expression classifier and the clinical model (solid line). Model performance for the clinical models was evaluated based on 1000 bootstrappings. Area under the ROC curve (AUC) and partial area under the curve (pAUC) at 80% sensitivity (shaded in grey) were calculated with bootstrap bias-corrected 95% confidence intervals (CI). The clinical model was composed of gender and the continuous variables of subject age and smoking history in pack-years (PKY) together with lung nodule size in a logistic regression model (Supplemental Materials, Supplemental Digital Content, http://links.lww.com/JTO/A773). The clinical plus classifier model included an additional parameter—the protein expression classifier score. Of the 141 subjects and lung nodules in the validation study cohort, one cancer sample and one benign sample were removed from the analysis due to missing PKY data; therefore, 139 samples were fitted in the logistic regression models, first with the clinical model alone and then with the clinical plus classifier model. The clinical model alone yielded an AUC of 0.591, whereas the clinical plus classifier model yielded an AUC of 0.634. The clinical model alone yielded a pAUC of 0.041, whereas the clinical plus classifier model yielded a pAUC of 0.062.