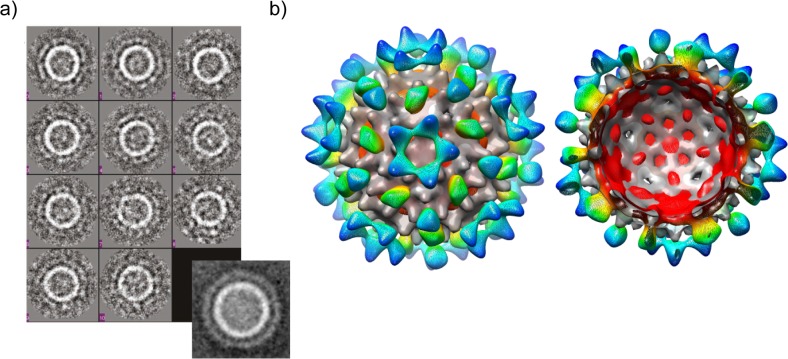
Fig 6. Cryo-EM analysis of plant-produced CoHe-GFPL VLPs.
a) Particles were flash-frozen in vitreous ice, then subjected to cryo-electron microscopy. Class averages were obtained from 441 individual particles using EMAN software. The expanded view (lower right) is of an average of all images used. b) 3D reconstruction of the particles using icosahedral symmetry, superimposed on the He map as shown in Fig. 3. The CoHe-GFPL map is coloured red-to-blue from the centre of the volume towards its edge; the He map is shown in grey.

