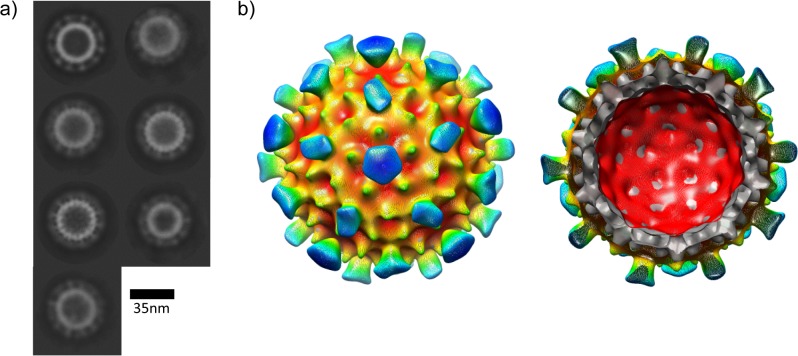
Fig 9. Cryo-EM of plant-produced τGFP bound with GFP.
a) Class averages computed using Relion of the τGFP particles. b) A 3D reconstruction (resolution estimate 25Å using the “gold standard” cross-FSC at cutoff 0.143) coloured by distance from the centre of the particle (red to blue). The map is shown viewed down a 5-fold axis with the He reconstruction on which the construct was based fitted within (grey surface). The projecting spikes represent density arising from the bound nanobody and GFP but do not occupy every position expected, instead appearing as an average of the density present with the highest intensity at the 2-fold (pseudo- 6-fold) axes and also at the 5-fold axis. These spikes are to some extent artefacts of the icosahedral symmetry imposed on the maps, but are reflected in the spikes also shown in the unaveraged class averages shown in a).

