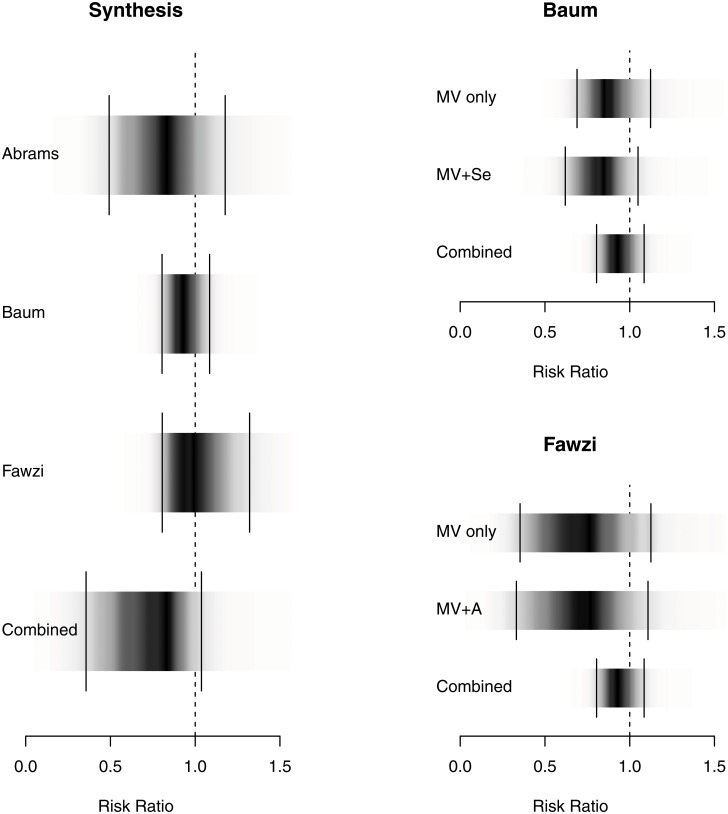
Fig 2. Density Strip Plot of Relative Risk of Progression to Clinical Disease/AIDS.
Bayesian random effects analysis (favors treatment on the left of 1.0); density plots on the figure on the left represent combined data; on the right accounts for individual study arms and the impact of adding selenium or vitamin A to MNS [55].

