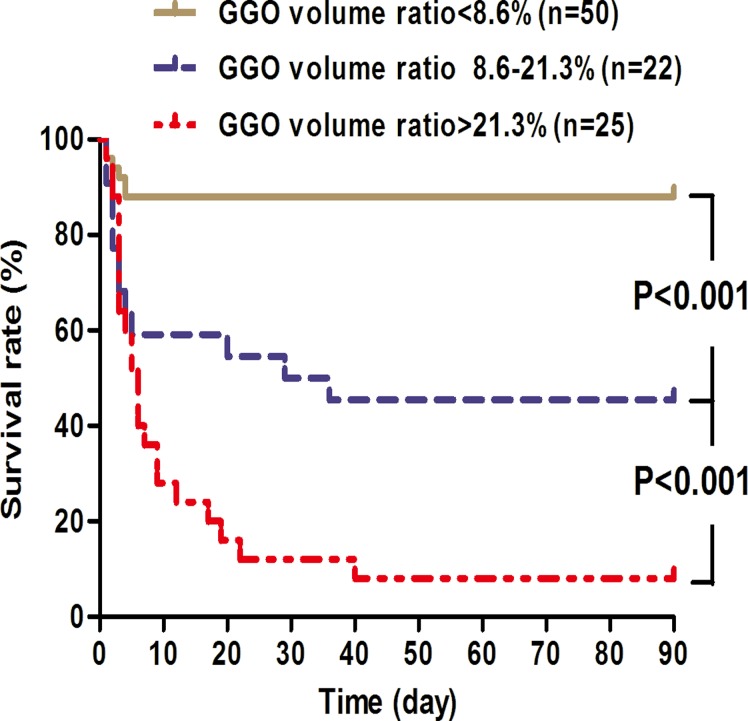
Fig 5. Kaplan-Meier survival curves of 97 paraquat poisoned cases stratified according to levels of GGO volume ratios within the first 5-day period.
Patients were categorized into three groups based on quartile levels of GGO volume ratios. Comparisons between curves showing difference with statistical significance (P < 0.05) are indicated.

