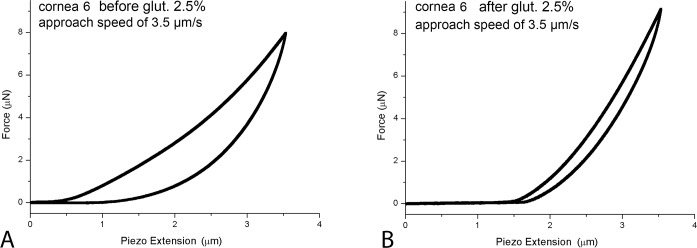
Fig 5. Representative force-displacement (F-D) curves before and after chemical corneal cross-linking using glutaraldehyde 2.5%.

In cornea 6, the F-D curves were acquired before (A) and after (B) chemical cross-linking at an approach speed of 3.5 μm/s and an applied load of 6.5 μN. After treatment, the slope of the approach curve becomes steeper and the area under the curves becomes smaller than baseline measurements. The tip-stromal interaction demonstrates both an increase of the elastic response and a decrease of the viscous response of the chemically cross-linked stroma.
