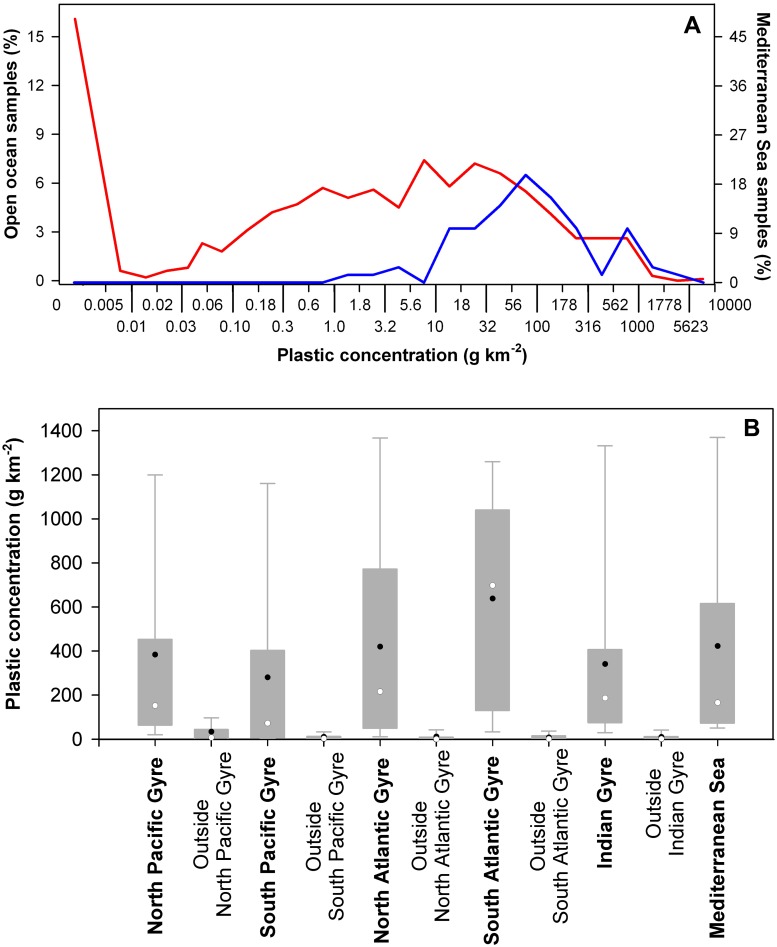
Fig 3. Ranges of surface plastic concentrations measured in the Mediterranean Sea, and reported for the open ocean.
A) Frequency distribution of the measurements of plastic concentrations in the Mediterranean Sea (n = 72) and in the global ocean (n = 1760). Mediterranean measurements (blue line) are from the present study and ref. [20, 21]; ocean measurements (red line), including the five plastic accumulations in the subtropical gyres, were compiled from ref. [1–5, 10, 11]. All these data are mapped in Fig. 2. Size limits of the bins, shown in the horizontal axis, followed a 2.5-log series of plastic concentration (in g km2). B) Surface plastic concentrations measured in the Mediterranean Sea, and reported for the inner accumulation zone of the five subtropical gyres (dark gray areas in Fig. 2) [1–5]. Ranges of concentrations outside the convergence zone of each subtropical gyre (white areas in Fig. 2) are also shown for comparative purposes. The boundaries of the boxes indicate the 25th and 75th percentiles, the whiskers above and below the boxes indicate the 95th and 5th percentiles, and the black and white dots mark mean and median respectively. All data in this analysis include correction by wind effect.

