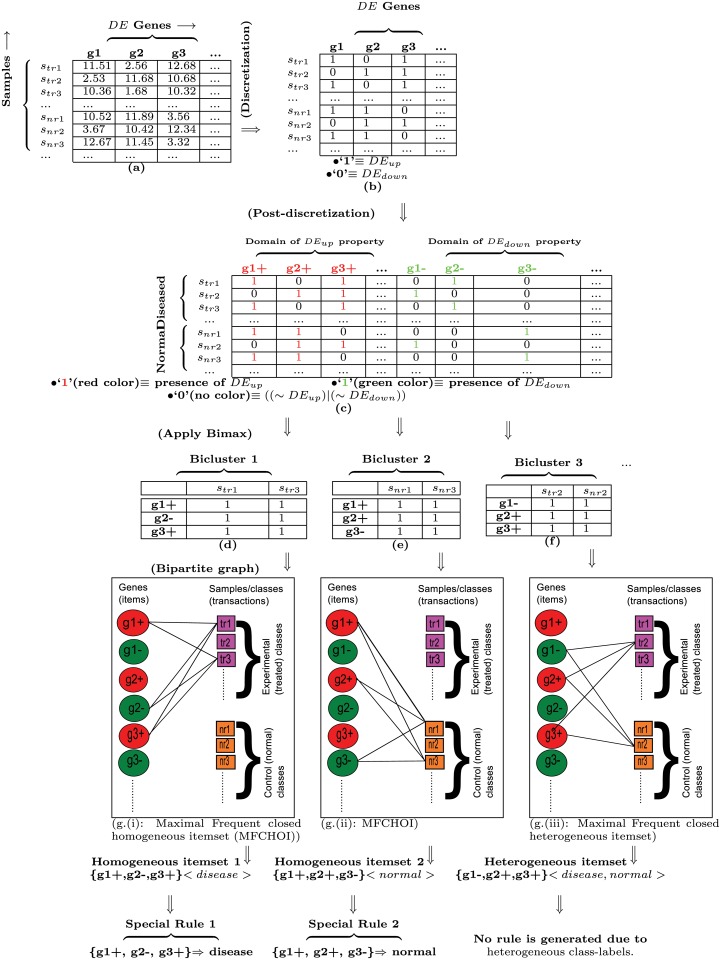
Fig 3. An example of generating special rules from data matrix of the differentially expressed genes.
Here, up-regulation (i.e., ‘+’) and down-regulation (‘-’) are denoted by ‘1’ and ‘0’ in (b), and red and green colors in (c), respectively. Here, s tr and s nr denote experimental/diseased/treated and control/normal samples respectively.

