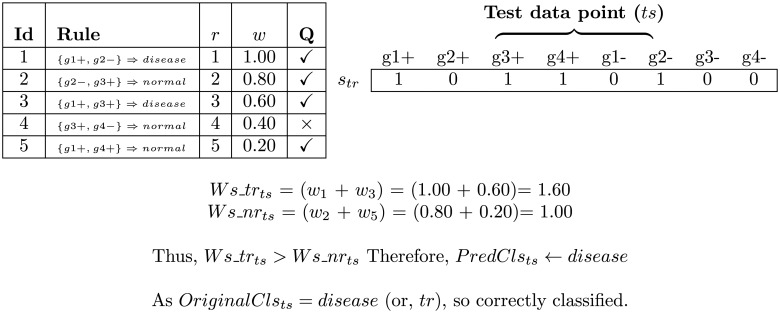
Fig 4. An example of classification of evolved rules by the majority voting using weighted-sum.
Here, ‘r’ and ‘w’ denote rank and weight of the rule (computed by Equation 18), respectively. Tickmark/crossmark in ‘Q’ column states that test-point (ts) is satisfied/non-satisfied by the corresponding rule.

