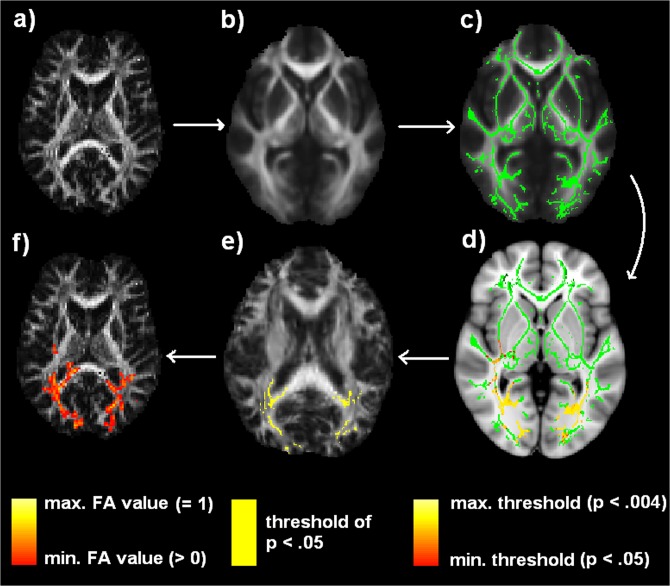
Fig 1. Analysis of the FA data using TBSS (Tract-Based spatial Statistics).
a) Individual FA map in native space; b) FA maps of all subjects, transformed into standard 1×1×1 mm MNI152 space and averaged; c) skeletonization of the mean FA image; d) voxel-wise statistics on the skeletonized FA data, indicating significant group differences (yellow: p < 0.004; red: p < 0.05); e) back-projection from averaged skeleton space to each subject’s standard space for post hoc correlation analyses (color indicates that a given skeleton point matches the threshold of p < 0.05 derived from the correct tract center points in each subject), f) back-projection to the space of the native data in FA providing each individual’s exact anatomical locations that contributed to the group effects (yellow: max. FA = 1; red: min. FA > 0, red).

