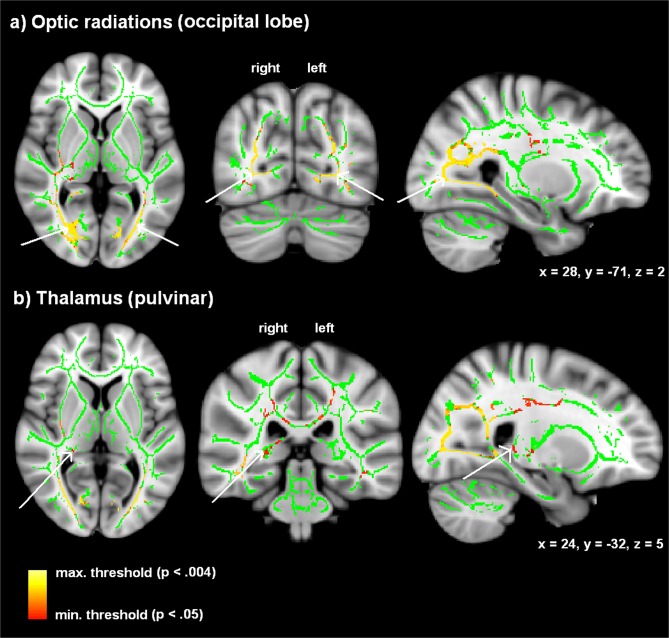
Fig 3. Clusters with reduced FA values in the late-blind compared to the sighted control group (yellow: p < 0.004; red: p < 0.05) overlaid on the mean FA skeleton map (green).
Significant effects were found within (a) the optic radiation of both hemispheres and (b) the right-hemisphere dorsal thalamus/Pv (threshold: TFCE statistic, family-wise error (FWE) corrected p < 0.05).

