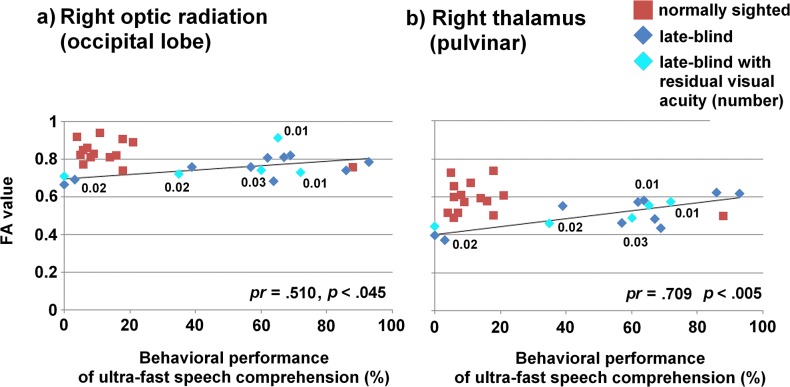
Fig 4. Scatter plots of FA values against the individual behavioral performance of understanding ultra-fast speech.
Regression lines, partial correlation coefficients, and significance levels refer to the late-blind group (blue diamonds) only, sighted controls (red squares) are only plotted for descriptive comparison. Values of visual acuity referred to late-blind individuals with residual visual perception (aqua diamonds).

