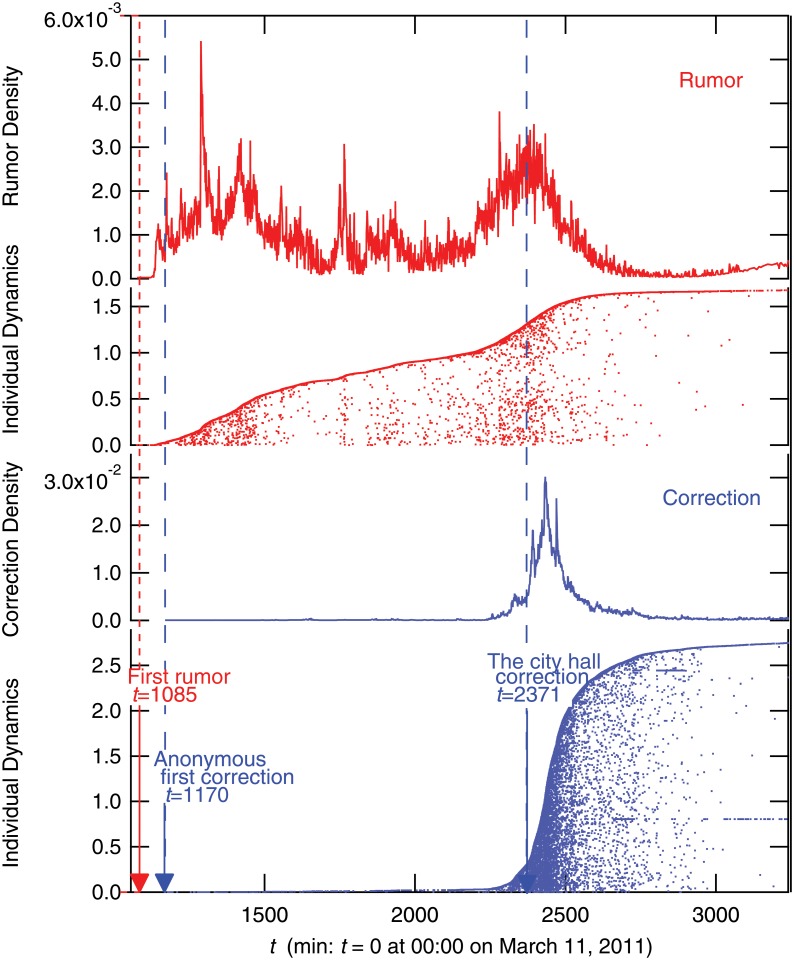
Fig 1. Time evolution and individual dynamics of rumor tweet R(t) (red) and rumor-correction R c(t) tweets (blue).
Time series is per minute and normalized by the total number of tweets. In the plot of individual dynamics, the vertical axis is user index, which is ordered by the time of the first appearance in the data set and normalized by the entire tweet volume.

