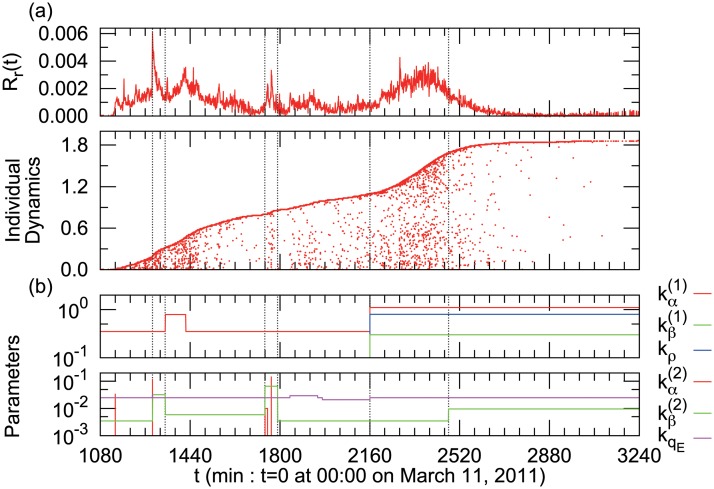
Fig 4. (a) Segmentation of the time series and estimated parameters.
Vertical dashed lines represent the boundaries of the segments in the simulation. These boundaries are determined manually by changes in the tweet density and curvature of individual dynamics. (b)Time series of parameter values in the simulation shown in Fig. 6(a). (Top) Coefficients of time-varying terms in Equation (2), (3), and (4). (Bottom) Coefficients of time-invariant terms in Equation (2), (3) and (5).

