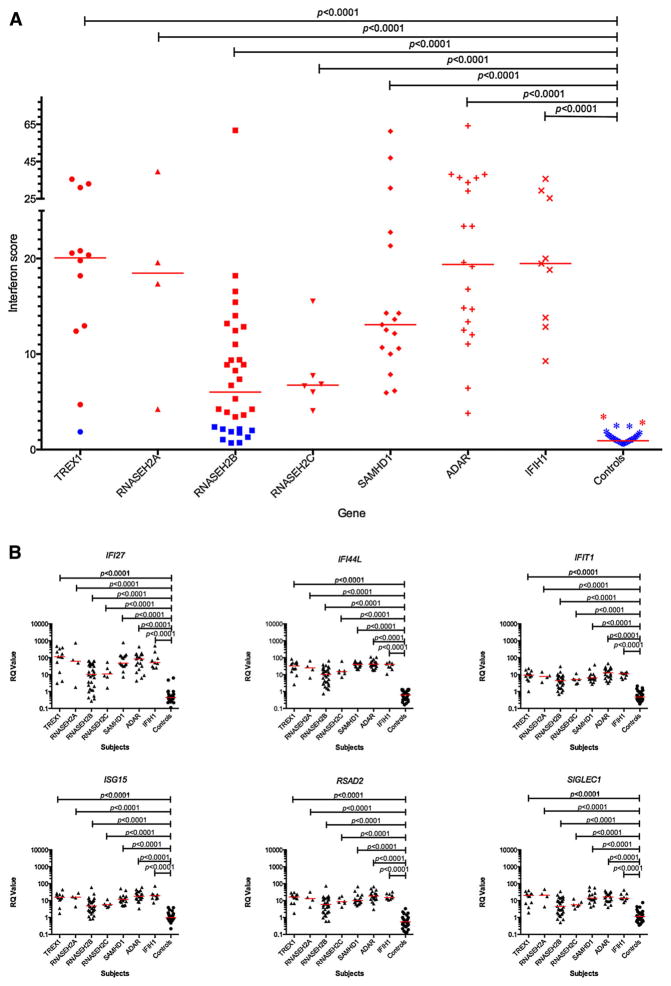
FIG. 7.
(A) Quantitative reverse transcription PCR (qPCR) showing the interferon score derived from a panel of six interferon stimulated genes (ISGs) measured in whole blood in 100 AGS patients and 29 controls. The median fold change of the six probes combined was calculated to given an interferon score for each individual. Red bars show the median RQ value for each probe in each group. Samples colored red have a positive interferon score (>2.4) whereas samples colored blue have a normal interferon score (within +2 SD of the median for the control population). For subjects with repeat samples, the median combined measurement is shown. RQ is equal to 2−ΔΔCt, i.e., the normalized fold change relative to a control. One way ANOVA with Dunnett’s multiple comparison test. Almost all patients demonstrate a positive interferon score compared to controls, except for individuals with mutations in RNASEH2B, where 31% of patients demonstrated a normal interferon signature. (B) ISG RQ by mutated gene compared to controls. Red bars show the median RQ value for each probe in each group. One way ANOVA with Dunnett’s multiple comparison test. These data sets include some measurements published previously [Rice et al., 2013a]. These data indicate a clear upregulation of the expression of the six interferon stimulated genes assayed in patients compared to controls, with lower median values in patients with mutations in RNASEH2B.

