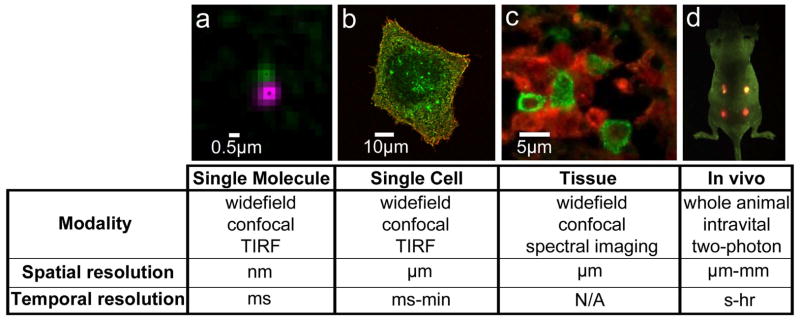
Figure 1. QDs are used in a range of biological imaging techniques.

a) Single molecule detection provides high spatiotemporal resolution. Example of two-color QD tracking of QD-labeled EGF bound to EGFR (see also Low-Nam et al, 2011). b) Live cell imaging captures dynamics of cellular processes. Image shows QD-EGF (red) binding to EGFR (green) on the surface of an A431 cell (see also Lidke et al, 2004). c) QDs used in immunohistochemistry (IHC) assays allow for multiplex imaging. Example of two-color QD-IHC in human spleen tissue with QD-labeled antibodies against mast cell tryptase (green) and c-Kit (red) (image by E.W. Hatch, Lidke Lab). d) QDs can be visualized in in vivo imaging. Image shows simultaneous in vivo imaging of spectrally distinct QD-encoded microbeads. Image courtesy of X. Gao (see also Gao et al, 2004).
