
Fig 1. Comparison of protein and glycoprotein profiles in different honeys by SDS-PAGE.
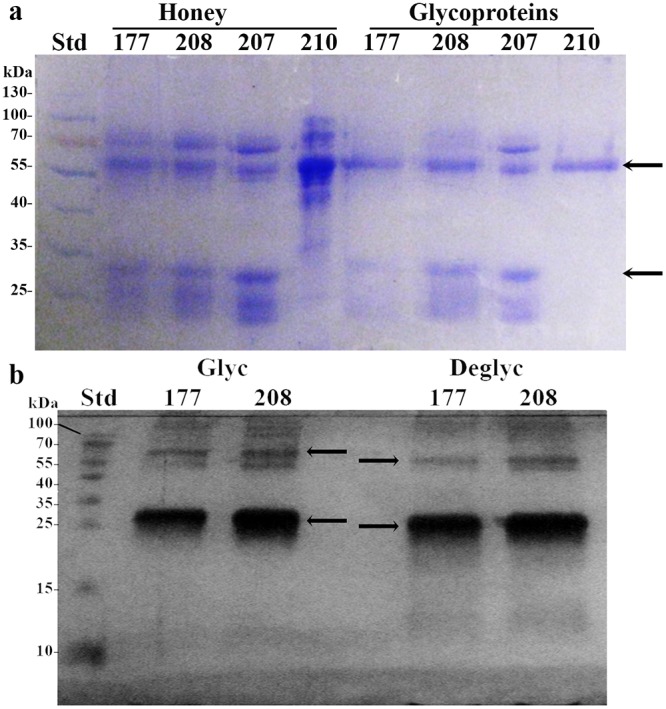
(a) Comparison of protein and glycoprotein profiles before and after ConA chromatography in different honeys. Arrows indicate positions of the 61kDa and 29 kDa proteins (b) Mobility shift of deglycosylated glycoproteins (the arrows).Std: standard molecular weight proteins.