
Fig 8. Effect of glycoprotein concentrations (1xMIC and 0.5xMIC) on survival of E. coli and B. subtilis.
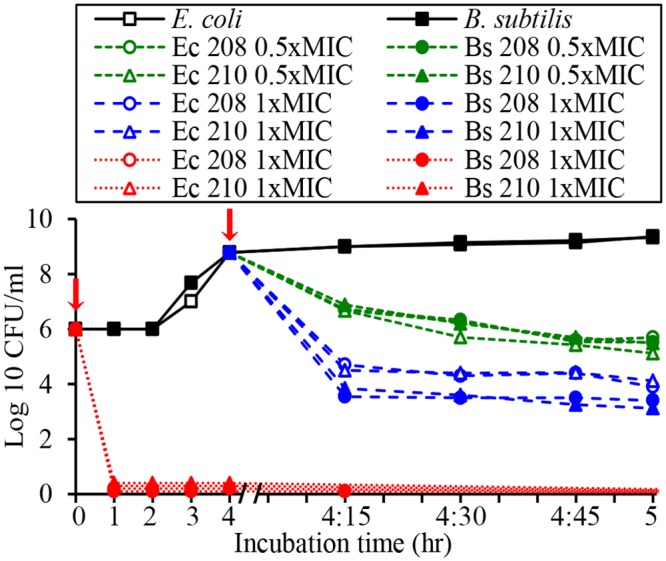
Arrows indicate time of addition of glps into bacterial cultures in lag phase (red line) and log phase (black line).
Official websites use .gov
A
.gov website belongs to an official
government organization in the United States.
Secure .gov websites use HTTPS
A lock (
) or https:// means you've safely
connected to the .gov website. Share sensitive
information only on official, secure websites.
Arrows indicate time of addition of glps into bacterial cultures in lag phase (red line) and log phase (black line).