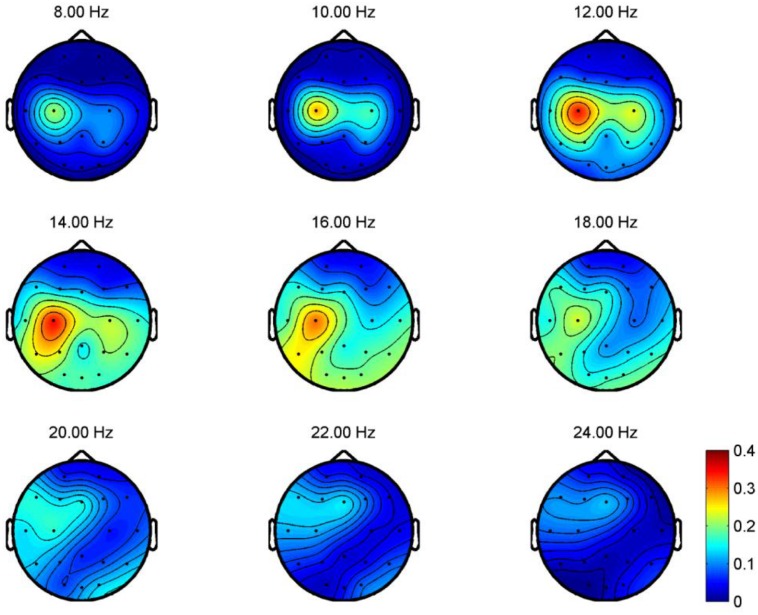
Fig 5. R2 values for REST vs MI-GRASP for P06.
R 2 measures the difference between two classes. In this figure, the R 2 values for frequency bands ranging from 8 to 24 Hz at each electrode locations are computed for all participants. Large R 2 values are observed at electrode locations near the contra-lateral motor cortex area.

