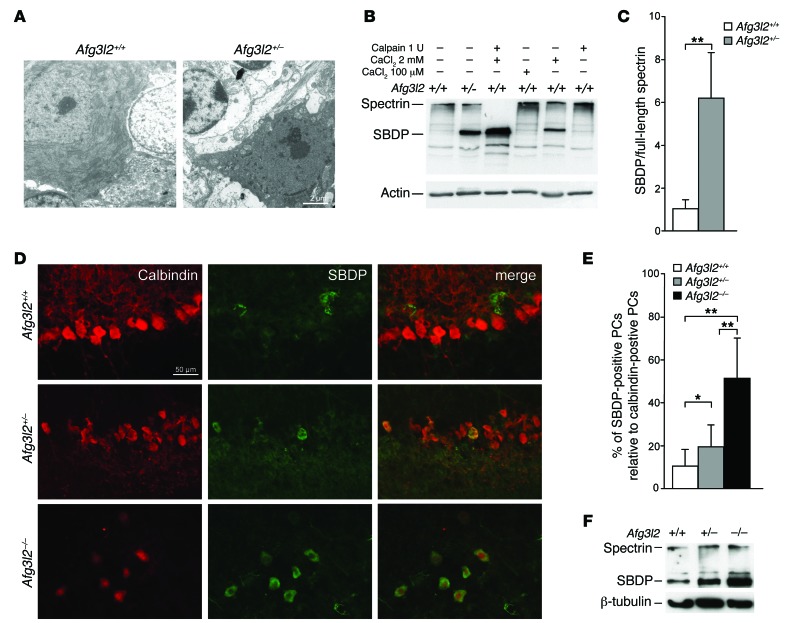
Figure 1. Reduced dosage of AFG3L2 in PCs induces dark degeneration.
(A) Ultrathin sections of cerebella from 6-month-old Afg3l2+/– and WT mice showing dark degeneration of PCs. Scale bar: 2 μm. (B) WB analysis of cerebellar extracts from Afg3l2+/– and WT mice. When indicated, CaCl2 and/or 1 U calpain were added. (C) Densitometric analysis of WB bands. Data represent the mean ± SD; n = 3; **P < 0.001 by Student’s t test. (D) IF images of organotypic cerebellar slices obtained from 10-day-old Afg3l2–/– and Afg3l2+/– mice and their WT littermates after AMPA exposure. Abs against calbindin and SBDPs were used. Scale bar: 50 μm. (E) Quantitative evaluation of dark-degenerated (SBDP-positive) PCs relative to the total number of PCs in cerebellar slices treated with AMPA. Data represent the mean ± SD; n = 4, with an average of 25 neurons analyzed per genotype per experiment. *P < 0.05 and **P < 0.001 by Student’s t test. (F) WB analysis of cerebellar slices revealing an increased amount of SBDPs in Afg3l2–/– and Afg3l2+/– mice compared with that detected in WT mice.

