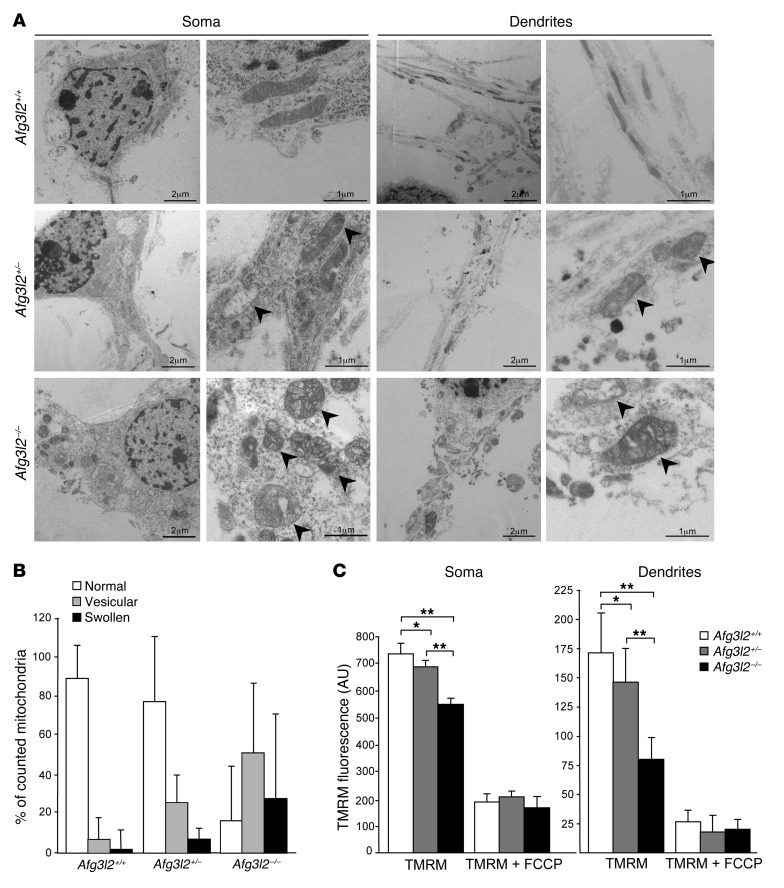
Figure 4. Afg3l2 depletion in PCs causes dramatic changes in mitochondrial ultrastructure and reduced membrane potential.
(A) EM of primary PCs at 14 DIV. Arrowheads indicate aberrant mitochondria. Scale bars: 2 μm (left panels, soma and dendrites); 1 μm (right panels, soma and dendrites). (B) Quantification of mitochondrial ultrastructural alterations. Organelles were classified as normal, vesicular, or swollen on the basis of inner membrane remodeling. Graph indicates the mean ± SD of an average of 200 mitochondria from 5 cells in 3 independent experiments. χ2 test (2 degrees of freedom): Afg3l2–/– versus either Afg3l2+/– or WT PCs, P < 0.001, WT versus Afg3l2+/–, P < 0.05. (C) Analysis of Δψmito in primary PCs by live-imaging measurement of TMRM fluorescence intensity in soma and dendrites, respectively. Data represent the mean ± SEM; n = 5, with an average of 40 cells analyzed per experiment. At the end of the experiments, 1 μM FCCP was added. *P < 0.05 and **P < 0.001 by Student’s t test.

