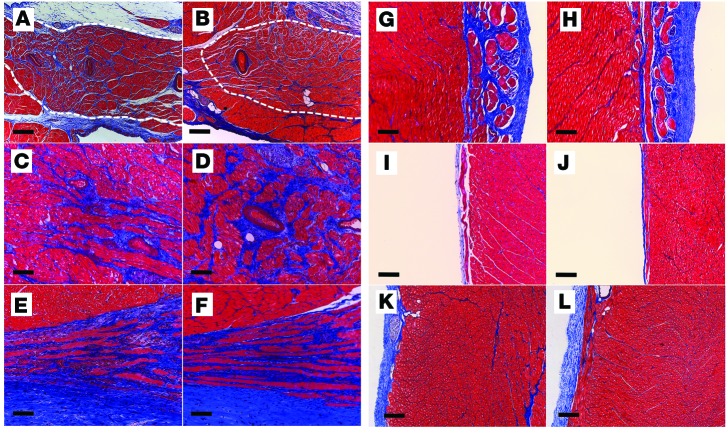
Figure 3. Cardiac structural evaluation of SCN5AE558X/+ pigs.
WT (A, C, E, G, I, and K) and SCN5AE558X/+ (B, D, F, H, J, and L) hearts were evaluated for fibrosis using Masson’s trichrome stain. Shown are representative sections from the sinoatrial node (A and B; dashed white outlines), AV node (C and D), proximal His bundle (E and F), left bundle branch (G and H), right bundle branch (I and J), and RVOT (K and L). Scale bars: 100 μm (A–J); 200 μm (K and L).

