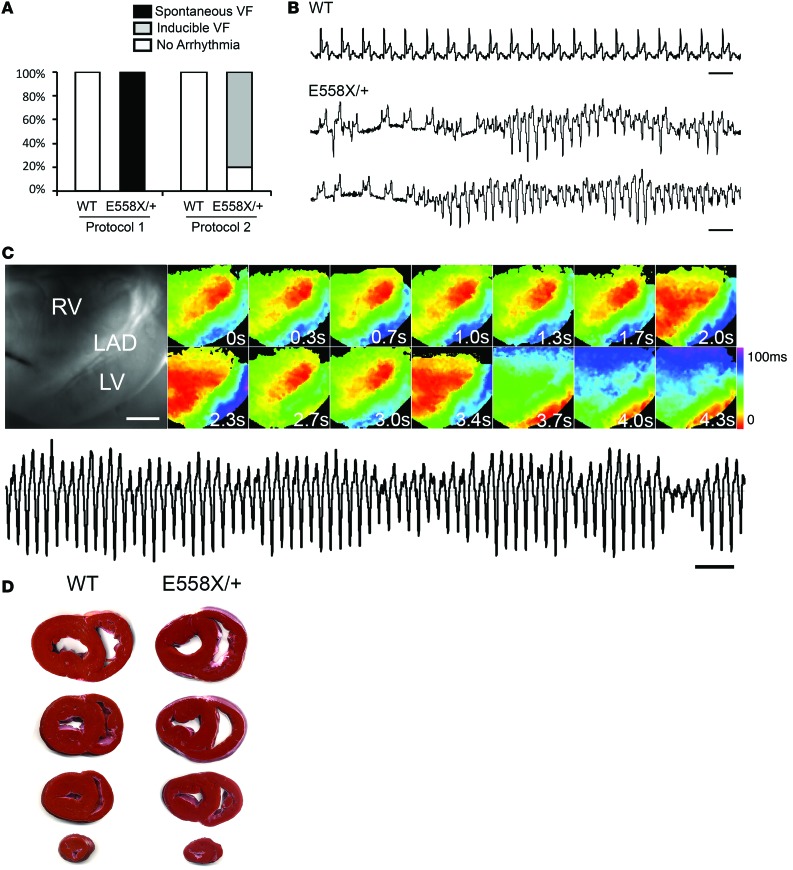
Figure 5. RV focal activity drives VF in SCN5AE558X/+ hearts.
(A) Spontaneous or pacing-induced VF events recorded using 2 perfusion protocols: immediate perfusion at 39°C (protocol 1), or initial perfusion temperature at 35°C with a slow ramp to 37°C (protocol 2). (B) Representative spontaneous ventricular arrhythmias in SCN5AE558X/+ hearts recorded on volume-conducted ECG. Scale bar: 1 second. (C) Brightfield image of the RV free wall. Scale bar: 2 cm. Sequential activation maps were recorded in an SCN5AE558X/+ heart during an episode of VF. Numbers indicate the relative start time of activation maps in each panel. Volume-conducted ECG of tachycardia is shown below. Scale bar: 1 second. (D) Representative TTC staining of WT and SCN5AE558X/+ hearts after Langendorff perfusion.

