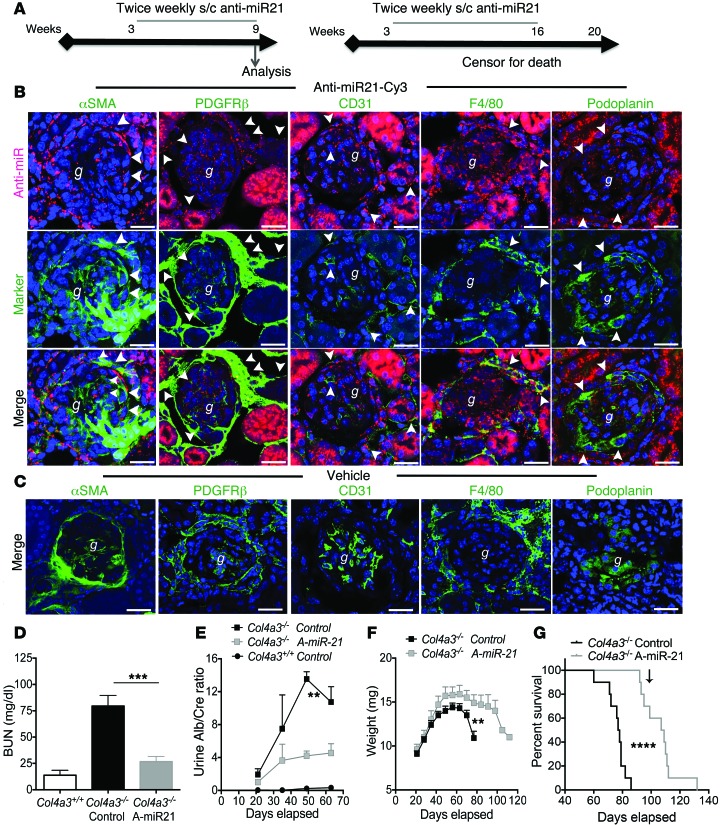
Figure 2. Anti–miR-21 is widely distributed to kidney cells, increases life span, and protects Col4a3–/– mice from kidney disease progression.
(A) Experimental schema indicating anti–miR-21 delivery from 3.5 weeks after birth and analysis at 63 days (9 weeks) or continued to 110 days (16 weeks). (B) Split panel confocal images of kidney cortex showing distribution of a single s.c. injection of Cy3-conjugated anti–miR-21 oligos (red) or vehicle 48 hours previously in 8-week-old Col4a3–/– mice. Sections were colabeled with antibodies against specific cellular markers of myofibroblasts, fibroblasts/pericytes and mesangial cells, endothelium, or podocytes to highlight uptake in particular cell types (arrowheads). Scale bars: 50 μm. g, glomerulus. (C) Confocal images showing vehicle control. Scale bars: 50 μm. (D) Graph of plasma BUN levels at 9 weeks. A-miR-21, anti–miR-21. (E) Graph of time course of urine albumin concentration normalized to urine creatinine. (F) Curves showing body weight changes with time. (G) Kaplan-Meier survival curve. Arrow indicates last delivery of anti–miR-21. **P < 0.01; ***P < 0.001; ****P < 0.0001, Gehan-Breslow-Wilcoxon test for survival; 1-way ANOVA or Mann-Whitney U test for others. n = 12/group.

