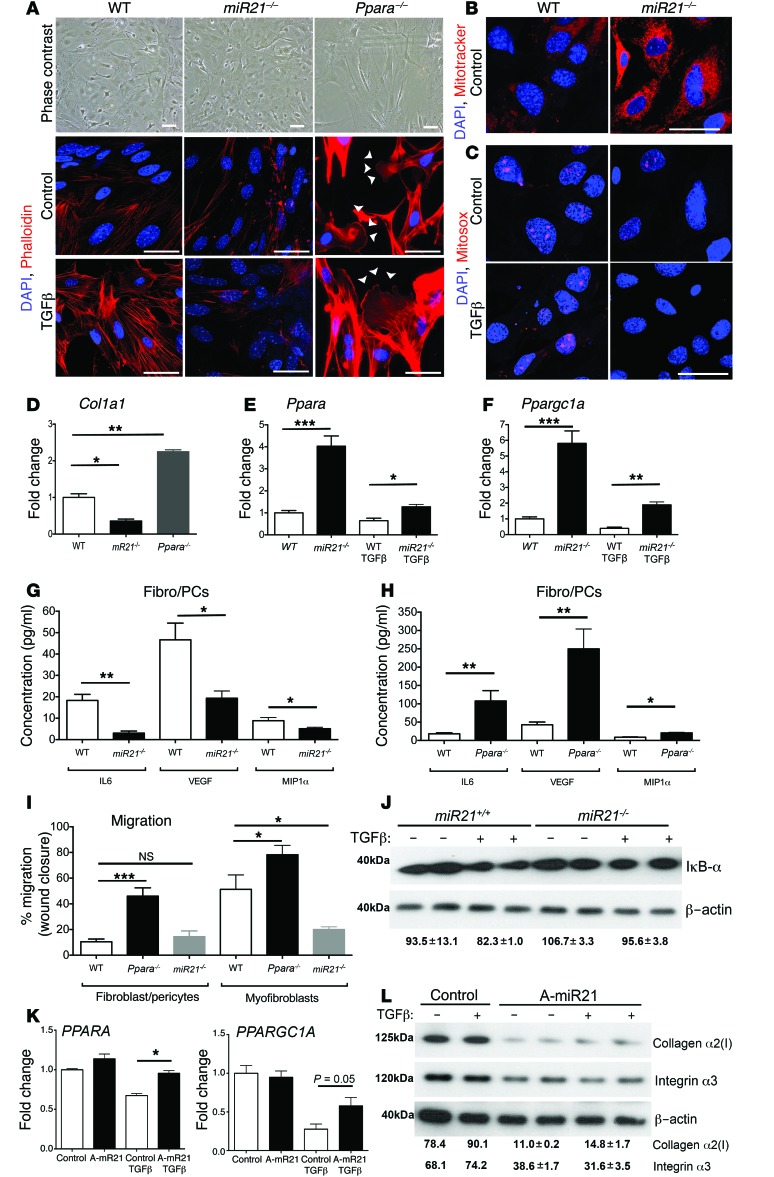
Figure 8. miR-21 activity regulates fibroblast/PC activation directly.
(A) Phase contrast or phalloidin-stained images of primary mouse kidney fibroblast (fibro/PC) cultures showing morphology and stress=fiber formation in control or TGF-β–activated conditions. Note that miR21–/– fibro/PCs have fewer stress fibers in both conditions, whereas Ppara–/– fibro/PCs have elongated morphology and increased lamellipodia formation (arrowheads). (B) Images showing mitochondrial density in miR21–/– fibro/PCs compared with WT fibro/PCs, detected by MitoTracker. (C) Images showing mitochondrial ROS generation in WT fibro/PCs in control or TGF-β–activated conditions compared with miR21–/– fibro/PCs. (D) Col1a1 transcript levels in primary fibro/PC cultures from mutant mouse kidneys or strain-matched control (WT). (E and F) Graphs showing expression of Ppara and Ppargc1a in mouse fibro/PCs in control or TGF-β–activated conditions. (G and H) Cytokines and growth factor secretion by fibro/PCs from (G) WT or miR21–/– kidneys or (H) WT or Ppara–/– kidneys. (I) Migration of WT, miR21–/–, Ppara–/– fibro/PCs and myofibroblasts in a wound-healing assay in control conditions. Note that miR21–/– cells are hypomigratory. (J) Western blot showing levels of the Ppar gene target IκB-α at rest and in response to TGF-β. (K) Graphs showing the effect of anti–miR-21 on transcript levels in human fibro/PCs in control or TGF-β–stimulated conditions. (L) Western blots showing effect of anti–miR-21 on human fibro/PC expression of C-JUN target genes: collagen I protein (60 kDa) and integrin-α3 (130 kDa), in control or TGF-β–stimulated conditions. Numbers indicate relative normalized band density. *P < 0.05; **P < 0.01; ***P < 0.001, 1-way ANOVA or Mann-Whitney U test. n = 3–5/group. Scale bars: 25 μm.

