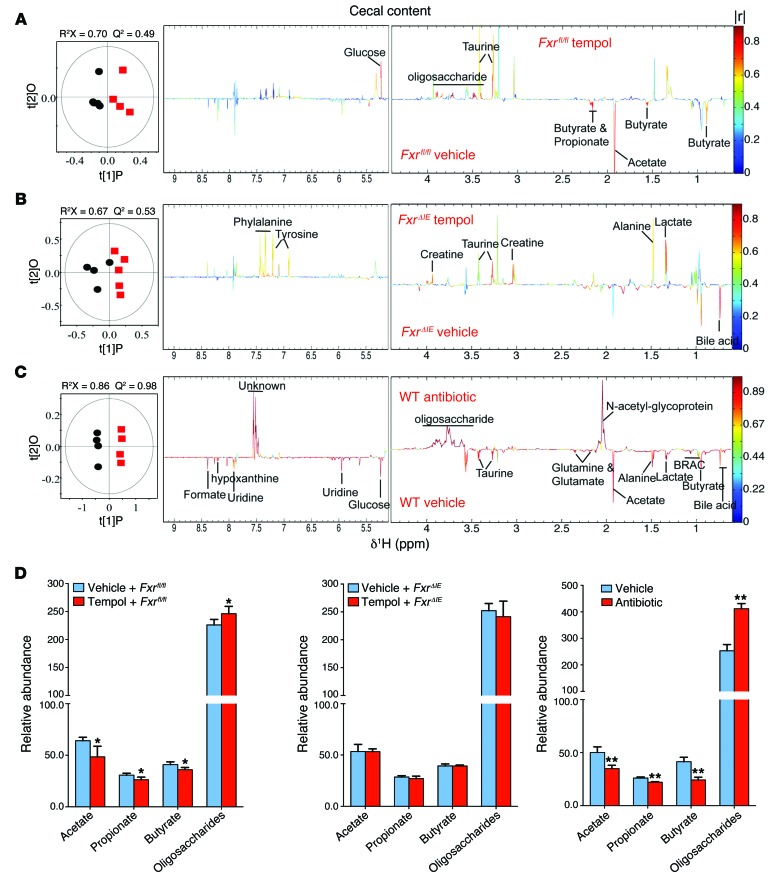
Figure 9. NMR metabolomic analysis of mouse cecal content extracts.
(A) OPLS-DA scores (left) and correlation coefficient–coded loadings plots for the models (right) from NMR spectra of cecal content aqueous extracts from vehicle-treated Fxrfl/fl mice and tempol-treated Fxrfl/fl mice fed a HFD for 16 weeks. n = 5 mice per group. (B) OPLS-DA scores (left) and correlation coefficient–coded loadings plots for the models (right) from NMR spectra of cecal content aqueous extracts from vehicle-treated FxrΔIE mice and tempol-treated FxrΔIE mice fed a HFD for 16 weeks. n = 4–5 mice per group. (C) OPLS-DA scores (left) and correlation coefficient–coded loadings plots for the models (right) from NMR spectra of cecal content aqueous extracts from vehicle-treated and antibiotic-treated mice fed a HFD for 7 weeks. The correlation coefficient values indicating significantly changed metabolites are shown in Supplemental Table 3. |r| cutoff value is 0.755, n = 5, P < 0.05; CV-ANOVA: P = 0.04, 0.02 and 1.18 × 10⁻⁴, respectively. n = 4–5 mice per group. (D) Relative abundance of SCFAs (acetate, propionate, and butyrate) and oligosaccharides in cecal content extracts from vehicle-treated Fxrfl/fl mice and tempol-treated Fxrfl/fl mice fed a HFD for 16 weeks, vehicle-treated FxrΔIE mice and tempol-treated FxrΔIE mice fed a HFD for 16 weeks, and vehicle-treated and antibiotic-treated mice fed a HFD for 7 weeks. n = 4–5 mice per group. Data are presented as the mean ± SD. *P < 0.05, **P < 0.01 (2-tailed Student’s t test) compared with vehicle-treated mice.

