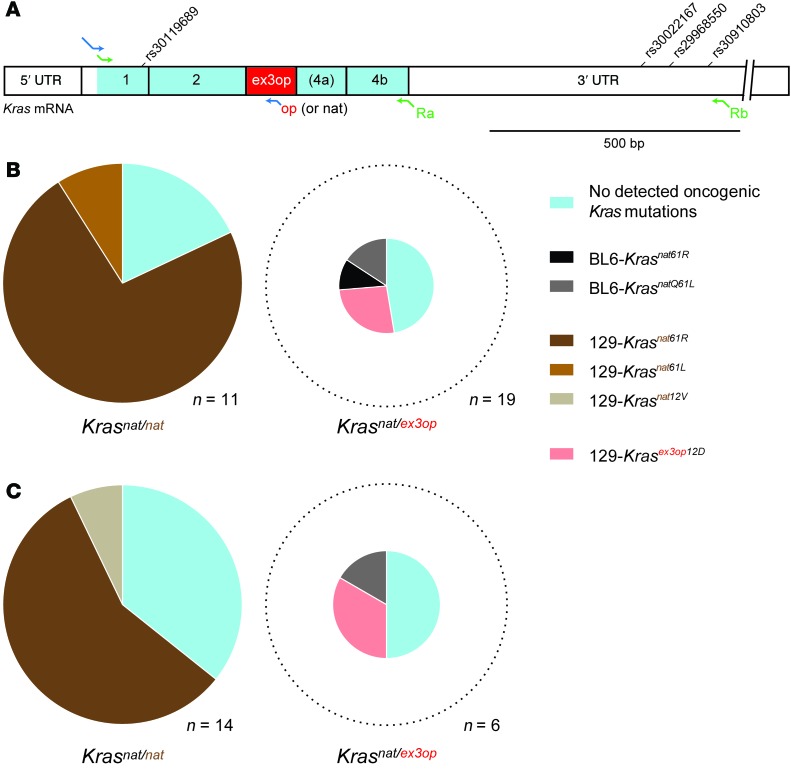
Figure 4. Detection of fewer and different mutations in the Krasex3op allele from tumors of mice treated with urethane.
(A) Amplification strategy for Kras RT-PCR including location of SNPs used for strain identification. Green arrows indicate primers for Sanger sequencing; blue arrows indicate primers for Ion Torrent sequencing. (B and C) Sequencing by the (B) Sanger and (C) Ion Torrent methods of Kras cDNAs from the indicated number (n) of tumors arising in the indicated urethane-treated cohorts revealed fewer and different mutations in the Krasex3op allele. Pie charts are sized to reflect differences in overall tumor multiplicity for each genotype.

