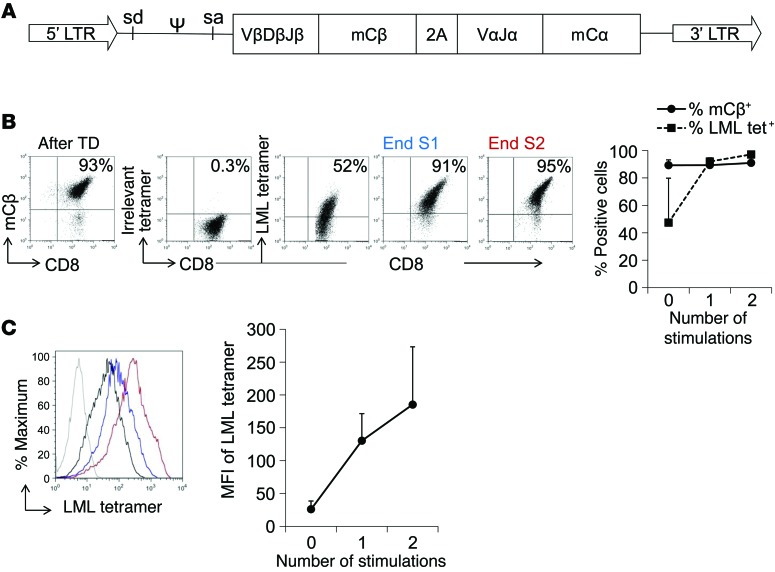
Figure 2. Efficient expression of the transgenic survivin-specific TCR by polyclonal CD8+ T cells.
(A) Scheme of the retroviral vector. sd, splice donor; sa, splice acceptor. (B) Transduction efficiency detected by staining for the mCβ and the LML tetramer. Enrichment of LML tetramer+ cells during T cell expansion in the presence of LML-pulsed aAPCs (2 weekly stimulations). Representative FACS plots immediately after transduction (After TD), and after 1 (End S1) or 2 (End S2) stimulations. Numbers indicate the percentage of positive cells in each quadrant. Graph shows the mean ± SD of 4 donors. (C) Increase in LML tetramer MFI after weekly antigen-specific stimulations. Representative histogram staining with irrelevant tetramer (gray), LML tetramer after TD (black), “End S1” (blue), and “End S2” (red). Graph shows the mean ± SD of 4 donors.

