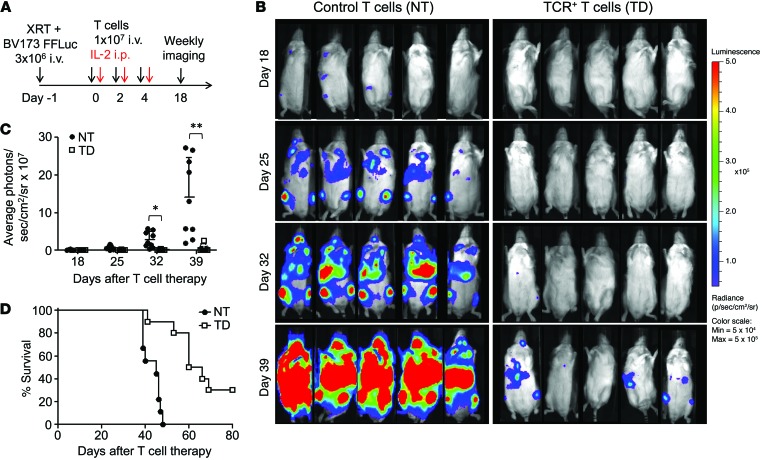
Figure 5. Survivin-specific TCR–redirected T cells have in vivo antileukemic activity.
(A) Experimental plan. Intravenous administration of 3 × 10⁶ BV173-FFluc cells to NSG mice after sublethal irradiation (120 cGy), followed by T cell infusions, IL-2, and weekly BLI starting on day 18. (B) Time course of BLI in representative individual mice from both treatment groups. Scale: 5 × 10⁴ to 5 × 10⁵ photons/second/cm2/sr. (C) Average photons/second/cm2/sr per mouse, determined by BLI, comparing mice treated with control T cells (NT, n = 9, black circles) or survivin-specific TCR+ T cells (TD, n = 10, white squares). Data represent the mean ± SD. *P = 0.01 at day 32 and **P = 0.009 at day 39, by Student’s t test with Bonferroni’s correction for multiple comparisons. The intensity signals were also log transformed, and the response profiles over time were analyzed by the robust generalized estimating equations method (P < 0.0001). Data represent 2 independent experiments. (D) Kaplan-Meier survival curve of mice treated with survivin-specific TCR+ T cells (TD) or control T cells (NT). P < 0.001 by generalized Wilcoxon test.

