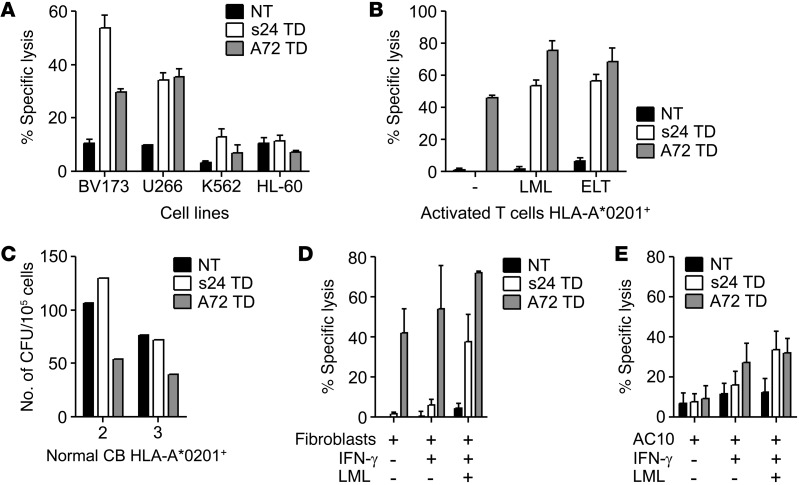
Figure 7. Fratricidal activity of allogeneic repertoire–derived survivin-specific TCR.
(A–E) Comparison of TCR+ T cells transduced with the s24 survivin-specific TCR (s24 TD, white bars) with the A72 survivin-specific TCR (A72 TD, gray bars) or NT control T cells (black bars). Data represent the mean ± SD of triplicate experiments for 2 to 4 donors. (A) 51Cr-release assay against HLA-A2+survivin+ (BV173 and U266) and HLA-A2–survivin+ (HL-60 and K562) cancer cell lines. Data represent the mean ± SD of triplicates for the percentage of specific lysis at an E/T ratio of 20:1. (B) 51Cr-release assay against activated HLA-A*0201+ target T cells in the absence of exogenous peptide (–) or pulsed with LML or ELT peptide. Data represent the mean ± SD of triplicates for the percentage of specific lysis at an E/T ratio of 20:1. (C) CFU assay with normal HLA-A2+ CB donors. Data represent the mean of duplicates at an E/T ratio of 10:1. 51Cr-release assay against HLA-A*0201+ fibroblasts (D) and the HLA-A*0201+ cardiomyocyte cell line AC10 (E) with IFN-γ pretreatment or IFN-γ pretreatment and pulsed with LML peptide. Data represent the mean ± SD of the percentage of specific lysis at an E/T ratio of 20:1 for 4 donors.

