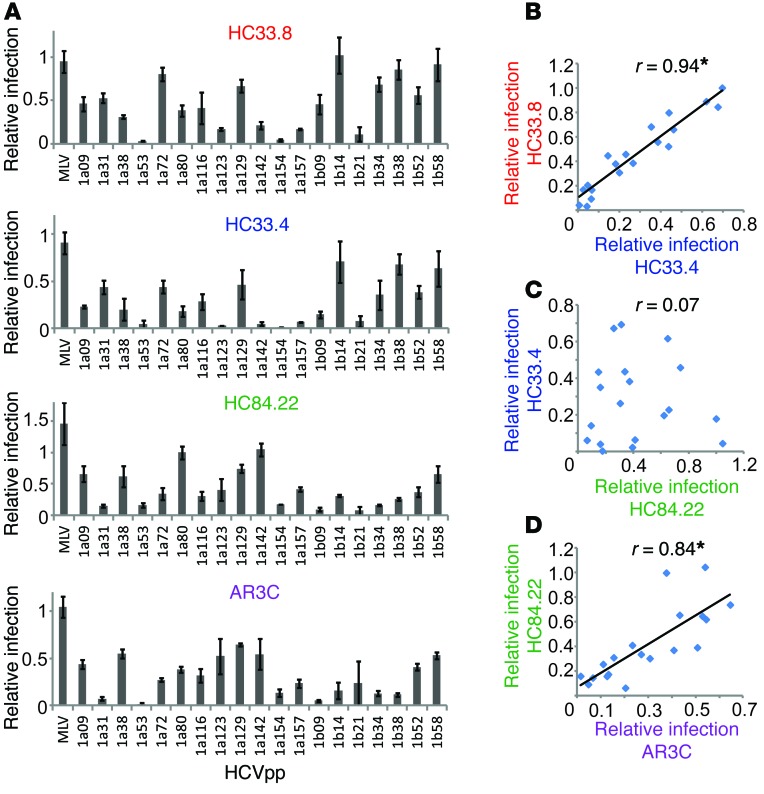
Figure 1. Ranking of library HCVpp resistance reveals relationships among mAbs.
(A) Each bar represents neutralization of a unique HCVpp by the indicated mAb. Representative mAbs are shown here, and neutralization results for all 18 mAbs are shown in Supplemental Figure 1. Relative infection is infection in the presence of 10 μg/ml neutralizing mAb relative to infection in the presence of nonspecific IgG. Error bars indicate SDs between duplicate wells. Pseudoparticles with murine leukemia virus (MLV) envelope serve as a negative control for neutralization. (B–D) Each blue diamond indicates neutralization of an individual pseudoparticle by one antibody on the x axis and a second antibody on the y axis. Spearman correlations (r) are indicated for each mAb pair. *P < 0.0001. (B) Comparison of HCVpp resistance to HC33.4 and HC33.8, 2 closely related mAbs targeting the same linear epitope. (C) Comparison of HCVpp resistance to 2 unrelated mAbs, HC33.4 and HC84.22. (D) Comparison of HCVpp resistance to AR3C and HC84.22, 2 mAbs with distinct epitopes based on alanine scanning but overlapping epitopes based on crystal structures.

