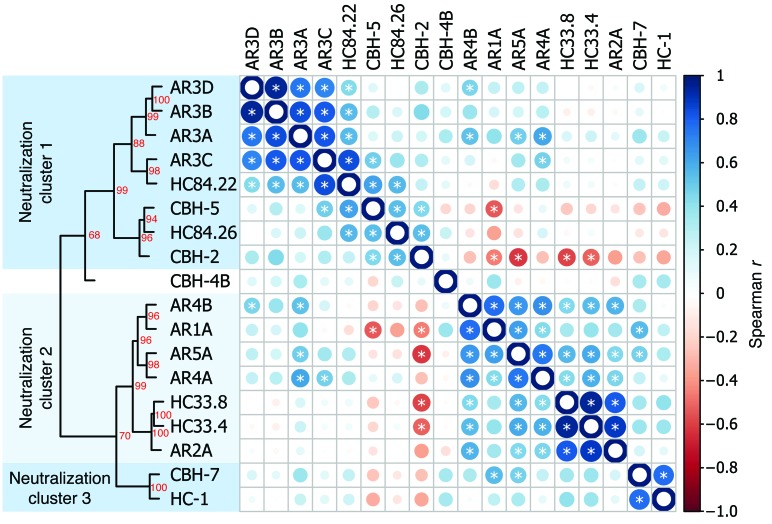
Figure 2. All neutralizing mAbs segregate into 3 neutralization clusters.
A heat map was generated using pairwise correlations among all mAb resistance profiles. Circles at each intersection are scaled by the magnitude of the Spearman correlation (r) between neutralization profiles of the indicated mAbs, with darker blue indicating higher r values. Open circles indicate identity. *P < 0.05. Hierarchical clustering analysis using pairwise correlations of neutralization resistance patterns is depicted as a tree. Numbers at tree nodes are approximately unbiased (AU) test values(42), which indicate strength of support for a particular cluster.

