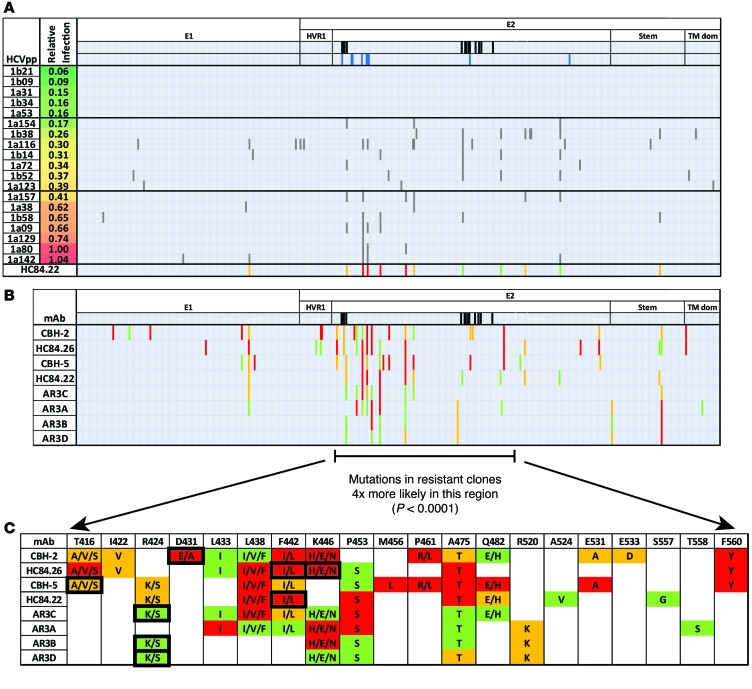
Figure 3. Sequence analysis reveals polymorphisms associated with neutralization resistance.
(A) Representative E1E2 sequence analysis to identify mAb HC84.22 resistance-associated polymorphisms. Similar analyses for the remaining NC1 mAbs are shown in Supplemental Figure 4. E1E2 clones are ranked by increasing resistance to HC84.22. Clones are grouped into the 5 most sensitive, 7 with intermediate resistance, and 7 with greatest resistance, separated by horizontal black lines. Gray vertical bars indicate positions with a substitution in any resistant E1E2 clone but in none of the 5 most sensitive E1E2 clones. Black vertical bars indicate CD81-binding sites in E2 determined by alanine scanning. Blue vertical bars indicate critical binding residues for HC84.22 determined by alanine scanning. Sites with substitutions in at least 2 resistant clones but in no sensitive clones are included in the summary panel in the bottom row. (A–C) Sites marked with red are predominantly polymorphic in the 7 most resistant clones. Orange indicates sites that are polymorphic in an equal number of highly resistant and intermediate resistant clones. Green indicates sites that are predominantly polymorphic in the 7 clones with intermediate resistance. (B) Compiled results for all NC1 mAbs. (C) Resistance-associated polymorphisms, with the more commonly observed polymorphism listed first. The amino acid found at each position in the 5 most neutralization-sensitive E1E2 clones is indicated in the top row. Black boxes indicate positions at which results from this analysis are concordant with alanine scanning mutagenesis results with the same mAb.

