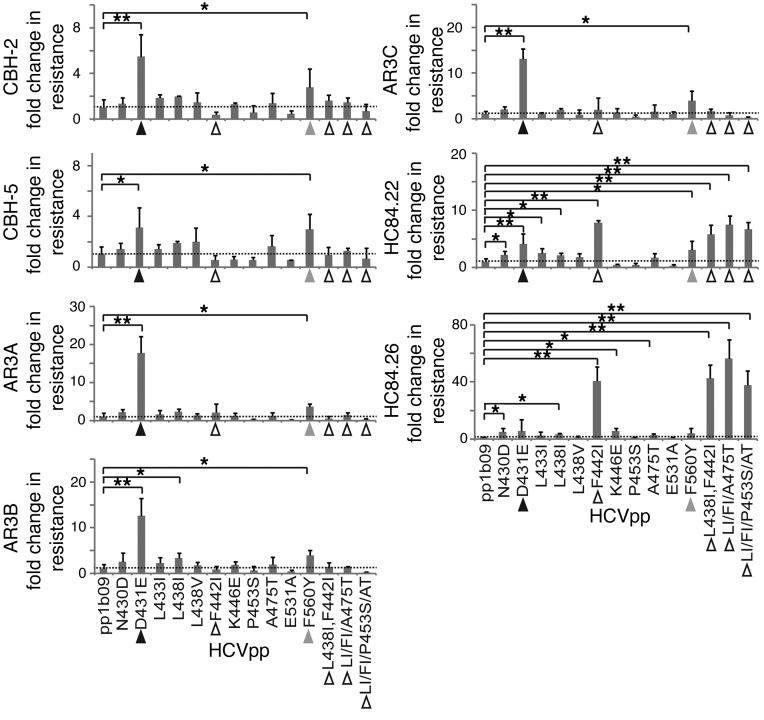
Figure 4. D431E, F442I, and F560Y mutations each confer resistance to multiple broadly neutralizing mAbs.
The dashed lines indicate relative infection of wild-type 1b09 HCVpp in the presence of the indicated mAb, adjusted to 1. Each bar indicates the fold change in HCVpp neutralization resistance relative to wild-type 1b09 after the indicated mutation(s) were introduced. Values are the means of 2 to 6 independent experiments performed in duplicate, and error bars indicate SD. *P < 0.05, **P < 0.005 by t test. Black triangles indicate HCVpp with D431E mutations. White triangles indicate HCVpp with F442I mutations. Gray triangles indicated HCVpp with F560Y mutations. pp1b09, HCVpp with wild-type E1E2 1b09.

