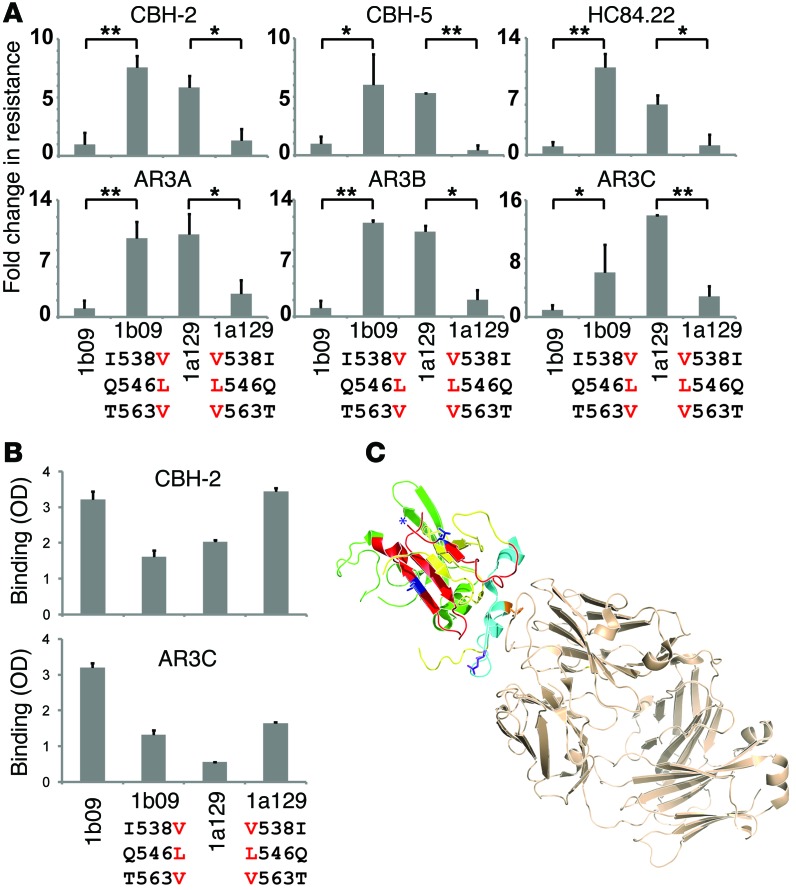
Figure 8. I538V/Q546L/T563V mutations in E2 confer resistance to 6 NC1 mAbs by reducing mAb binding to E1E2.
(A) The first bar in each graph indicates relative infection of wild-type pp1b09 in the presence of the indicated mAb, adjusted to 1. Subsequent bars indicate fold change in neutralization resistance of the indicated HCVpp relative to pp1b09. Values are the means of 2 to 6 independent experiments performed in duplicate, and error bars indicate SD. *P < 0.05, **P < 0.005 by t test. (B) Binding of mAbs CBH-2 and AR3C to E1E2 protein in an ELISA. For each mAb, binding to each of the E1E2 variants was compared at a single mAb concentration selected to produce binding within the linear range of the assay. Values are normalized for relative binding of control NC2 mAb HC33.4. Error bars indicate SD between duplicate wells. (C) Crystal structure from Kong et al. of E2 core with AR3C (34), from the Protein Data Bank, accession 4MWF, with E2 colors modified as in Figure 5. Residue 431 is purple, residue 442 is orange, and residues 538 and 563 are blue. The likely position of residue 546 is indicated with a blue asterisk. AR3C Fab is tan.

