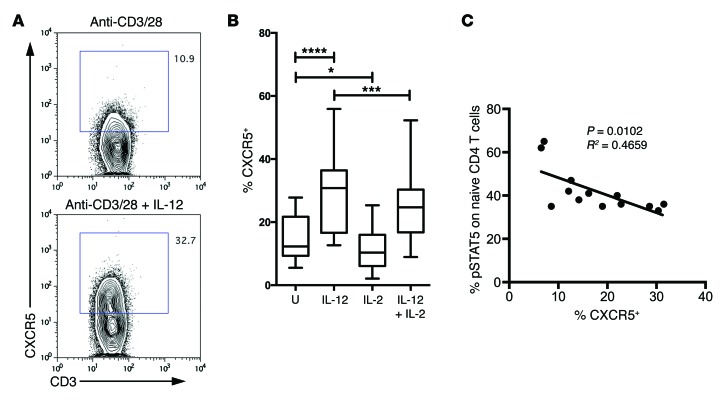
Figure 8. Patients who respond poorly to IL-2 show an increased propensity to upregulate CXCR5.
(A) Sorted CD4+CD45RA+ naive T cells from patients with T1D were cultured for 5 days with anti-CD3/anti-CD28 beads in the presence or absence of IL-12. Plots show representative CXCR5 staining. The percentage of gated CXCR5+ cells is shown on the graph. (B) Graphs show CXCR5 MFI of 5 independent experiments in which naive T cells were cultured for 5 days as above with IL-12 and or IL-2 (n = 15). Box and whisker plots show the median, interquartile range, and 10th to 90th percentile. *P ≤ 0.05, ***P ≤ 0.001, ****P ≤ 0.0001. U, untreated. (C) Relationship between CXCR5 induction and sensitivity of T cells to IL-2. CD4+ T cells from patients with T1D were treated with 100 U IL-2 for 10 minutes and then fixed and stained for phosphorylated STAT5 (pSTAT5). The percentage of pSTAT5+ is plotted against the proportion of CXCR5+ cells induced by culture in the presence of IL-12 (as in A and B) (n = 13).

