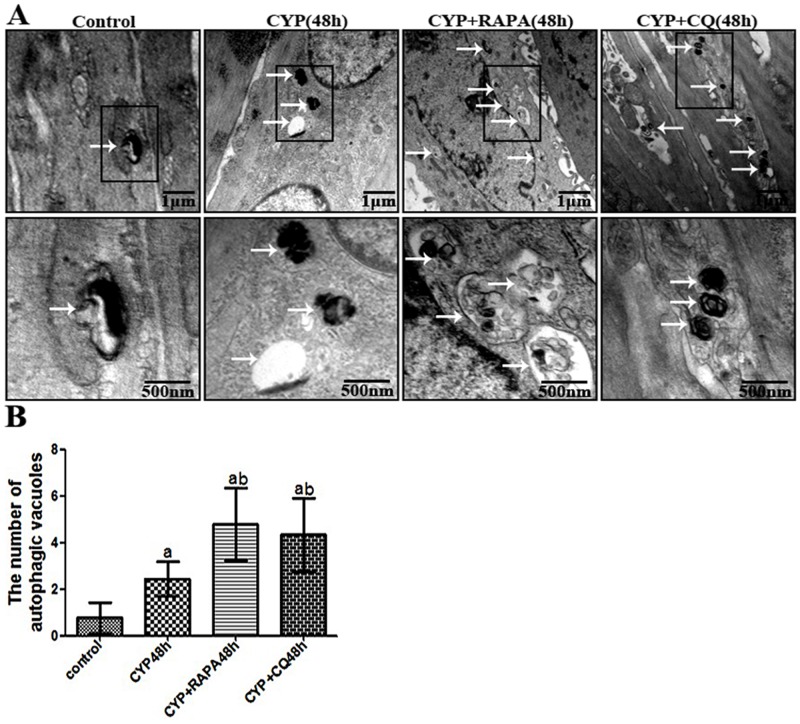
Fig 3. Confirmation of the autophagy in CYP-treated rat detrusor myocytes with electron microscopy.
(A) Representative high magnification electron micrographs showing autophagic vacuoles in detrusor myocytes of rat (upper panels: arrows demonstrate vesicles; scale bars, 1 μm) and cytoplasmic goods in autophagic vacuoles (lower panels; scale bars, 500nm), respectively. (B) A statistical chart of the number of autophagic vacuoles in control rats, CYP-treated 48h rats, CYP+RAPA-treated 48h rats, and CYP+CQ-treated 48h rats, n = 7. Data are expressed as the mean ± SD, a indicates a significant difference compared to the control group value(P <0.05). b indicates a significant difference compared to the CYP group value(P <0.05).

