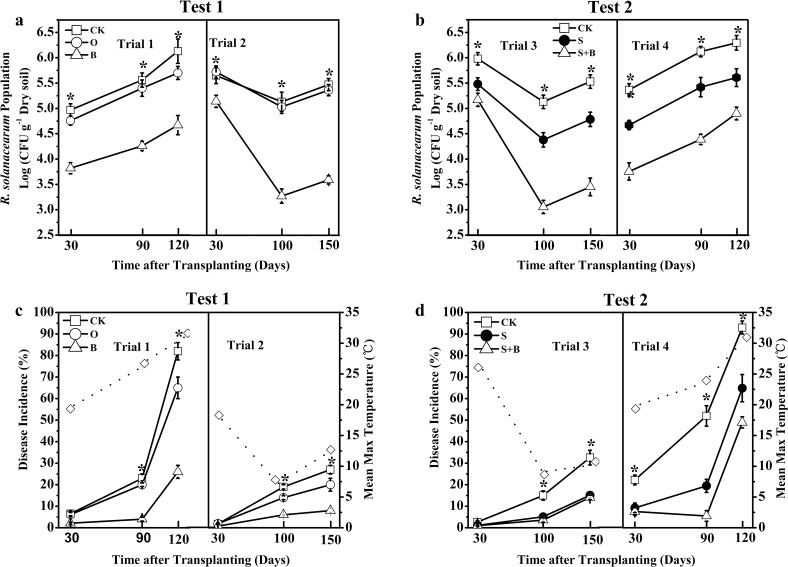
Fig 1. Population of Ralstonia solanacearum in soil and disease incidence over time in Test 1 (a and c) and Test 2 (b and d).
The dotted lines and ◇ represent the mean max temperature in the above time periods in different trials. CK: NPK fertilizer; O: NPK fertilizer + organic fertilizer; B: NPK fertilizer + bioorganic fertilizer; S: NPK fertilizer + soil disinfection; S+B: soil disinfection + NPK fertilizer + bioorganic fertilizer. * indicates the significant difference between the treatments at the 0.05 probability level according to the Duncan’s test.

