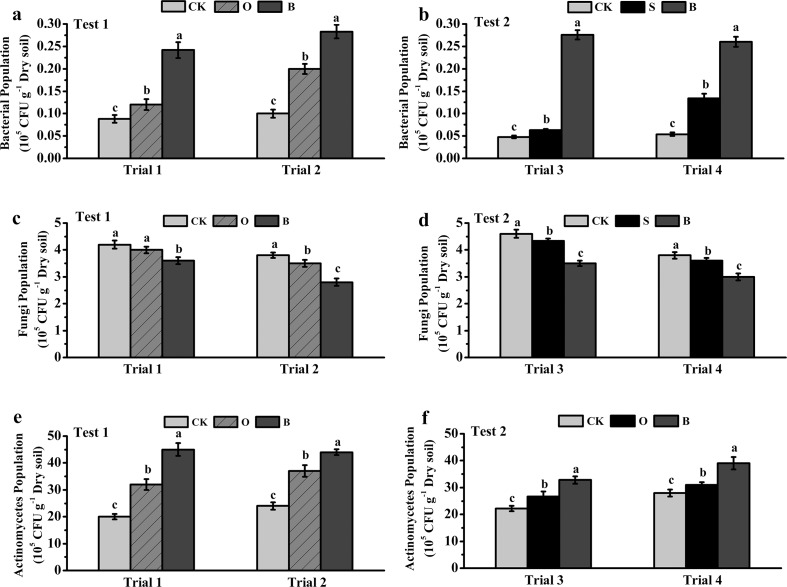
Fig 4. The population of bacteria (a and b), fungi (c and d), and actinomycetes (e and f) in soils from different treatments in Test 1 (a, c and e) and Test 2 (b, d and f).
CK: NPK fertilizer; O: NPK fertilizer + organic fertilizer; B: NPK fertilizer + bioorganic fertilizer; S: NPK fertilizer + soil disinfection; S+B: soil disinfection + NPK fertilizer + bioorganic fertilizer. Bars with different letters indicate a significant difference between the treatments, as defined by Duncan’s test (P<0.05).

